

Question: Consider the Pivot Table below. Suppose we want to understand how the distribution of responses varies among the three groups. we should Show Values As....
- Consider the Pivot Table below. Suppose we want to understand how the distribution of responses varies among the three groups. we should Show Values As....
a% of Row Total
b% of Column Total
c% of Grand Total
d% of Parent Row Total
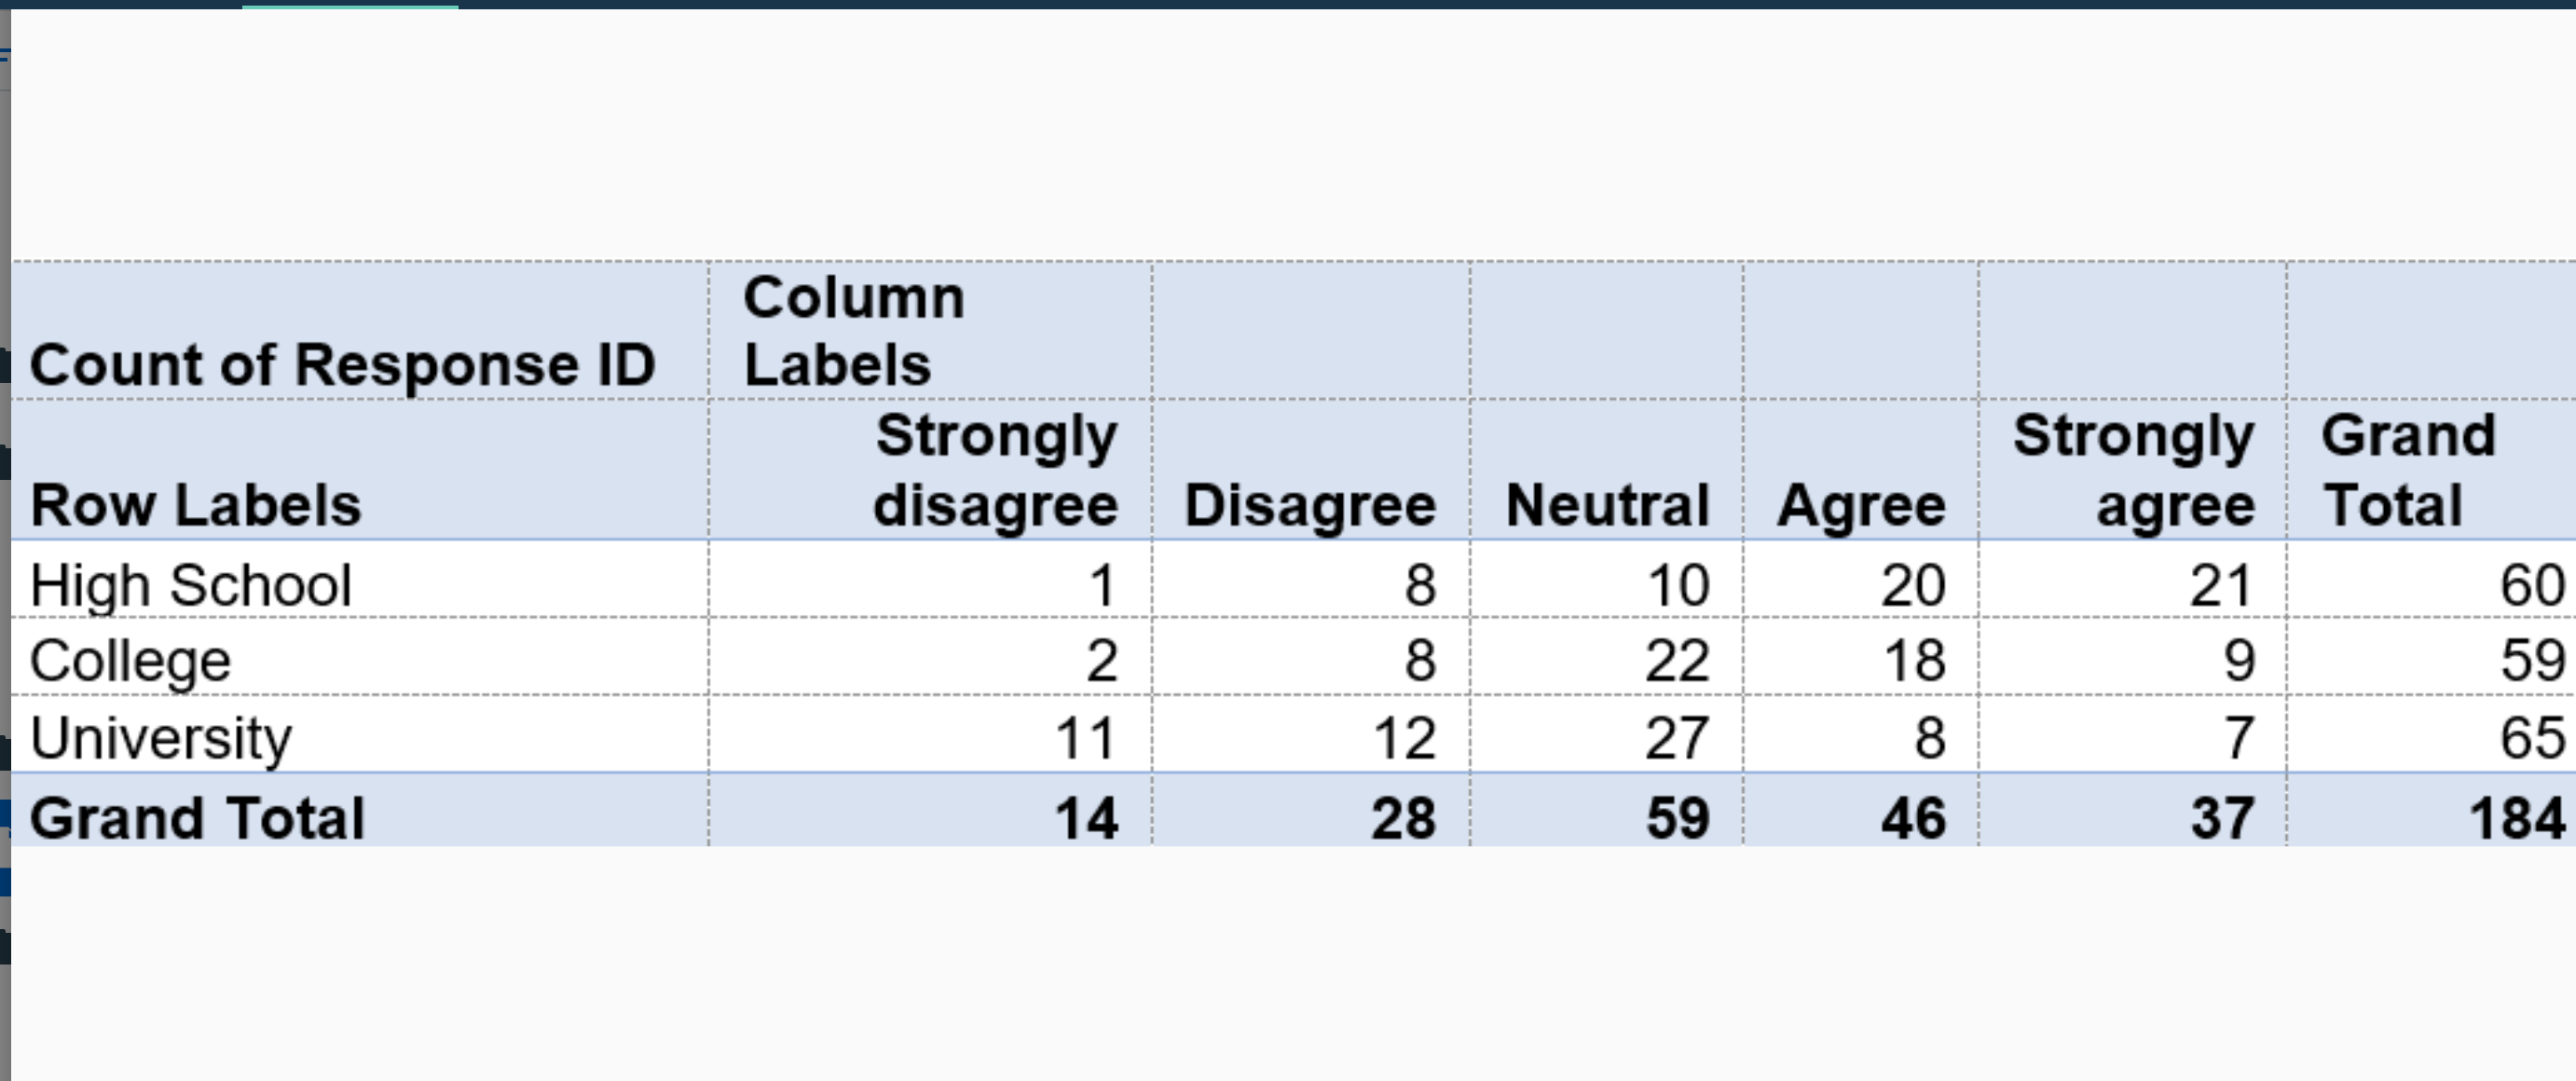
Column Count of Response ID Labels Strongly Strongly Grand Row Labels disagree Disagree Neutral Agree agree Total High School 8 10 20 21 60 College 2 8 22 18 9 59 University 11 12 27 8 7 65 Grand Total 14 28 59 46 37 184
Step by Step Solution
There are 3 Steps involved in it
1 Expert Approved Answer
Step: 1 Unlock

Question Has Been Solved by an Expert!
Get step-by-step solutions from verified subject matter experts
Step: 2 Unlock
Step: 3 Unlock