

Question: Consider the probability density curve plotted below: Density Curve 0.055 0.05 0.045 0.04 0.035 0.03 PDF(X) 0.025 0.02 0.015 0.01 0.005 I 28 30 32
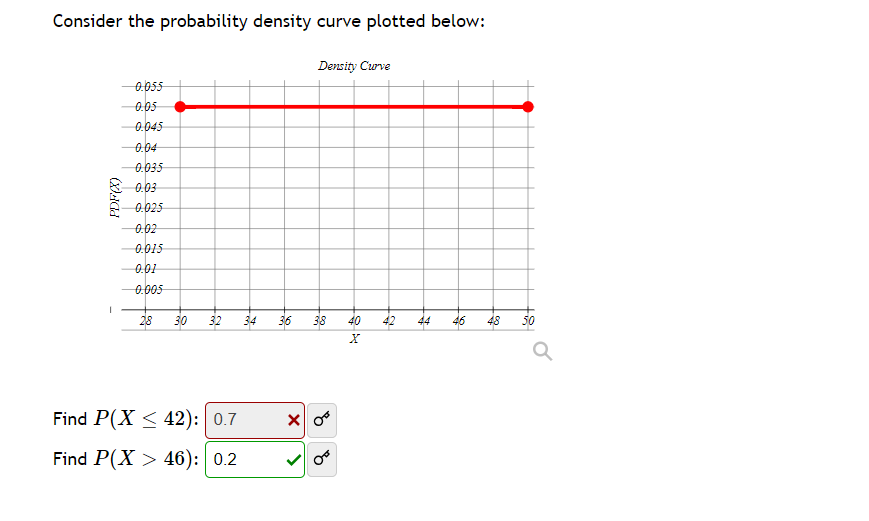 Consider the probability density curve plotted below: Density Curve 0.055 0.05 0.045 0.04 0.035 0.03 PDF(X) 0.025 0.02 0.015 0.01 0.005 I 28 30 32 3 36 38 40 42 44 46 48 50 Q Find P(X 46): 0.2 V
Step by Step Solution
There are 3 Steps involved in it
1 Expert Approved Answer
Step: 1 Unlock

Question Has Been Solved by an Expert!
Get step-by-step solutions from verified subject matter experts
Step: 2 Unlock
Step: 3 Unlock