

Question: Consider the queueing problem in Question 1. NOTE-1: SHOW ALL YOUR WORK. USE 4 DECIMAL PLACES IN ALL CALCULATIONS. a) Data was collected on the
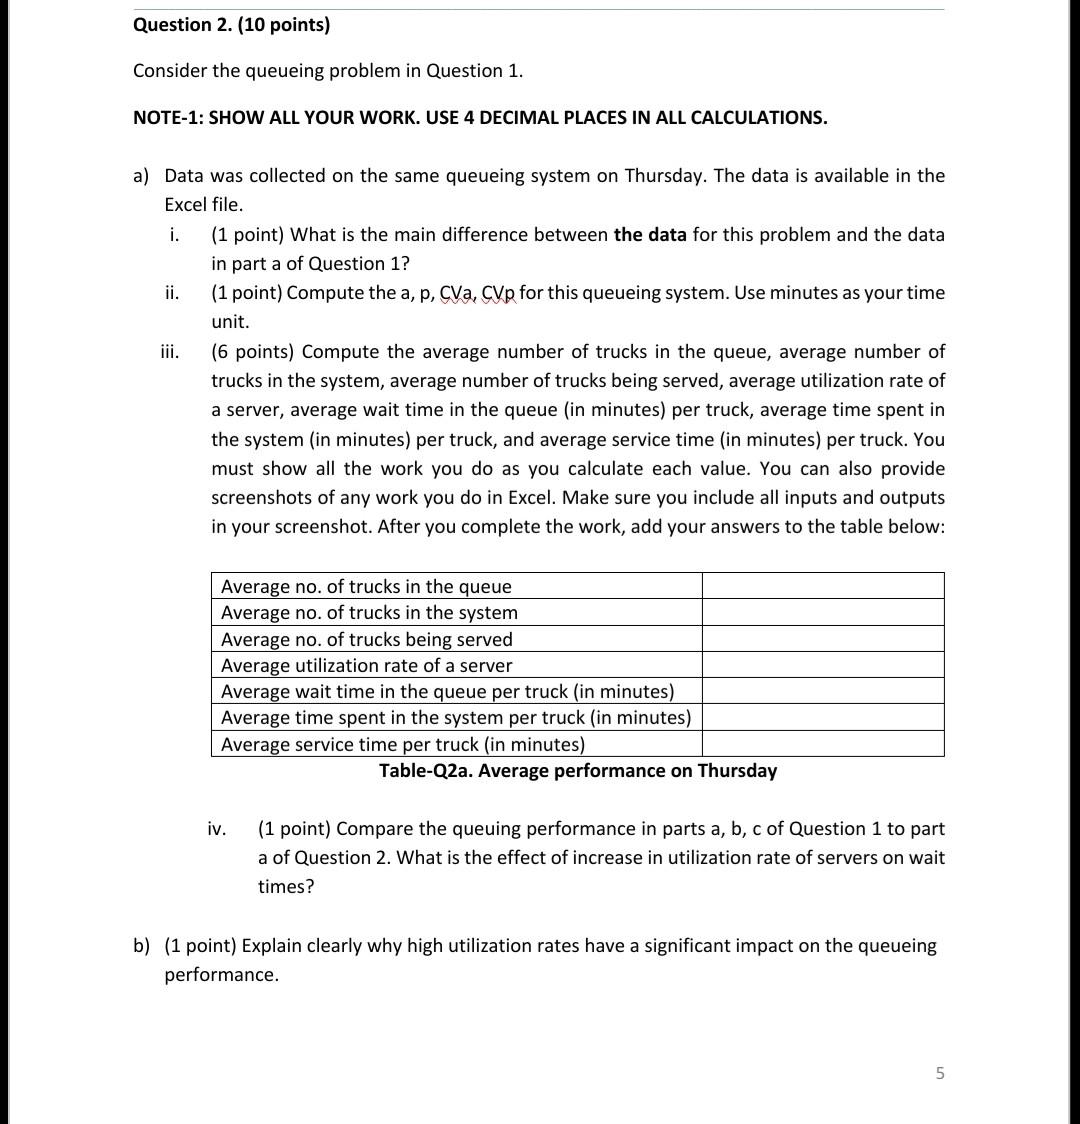
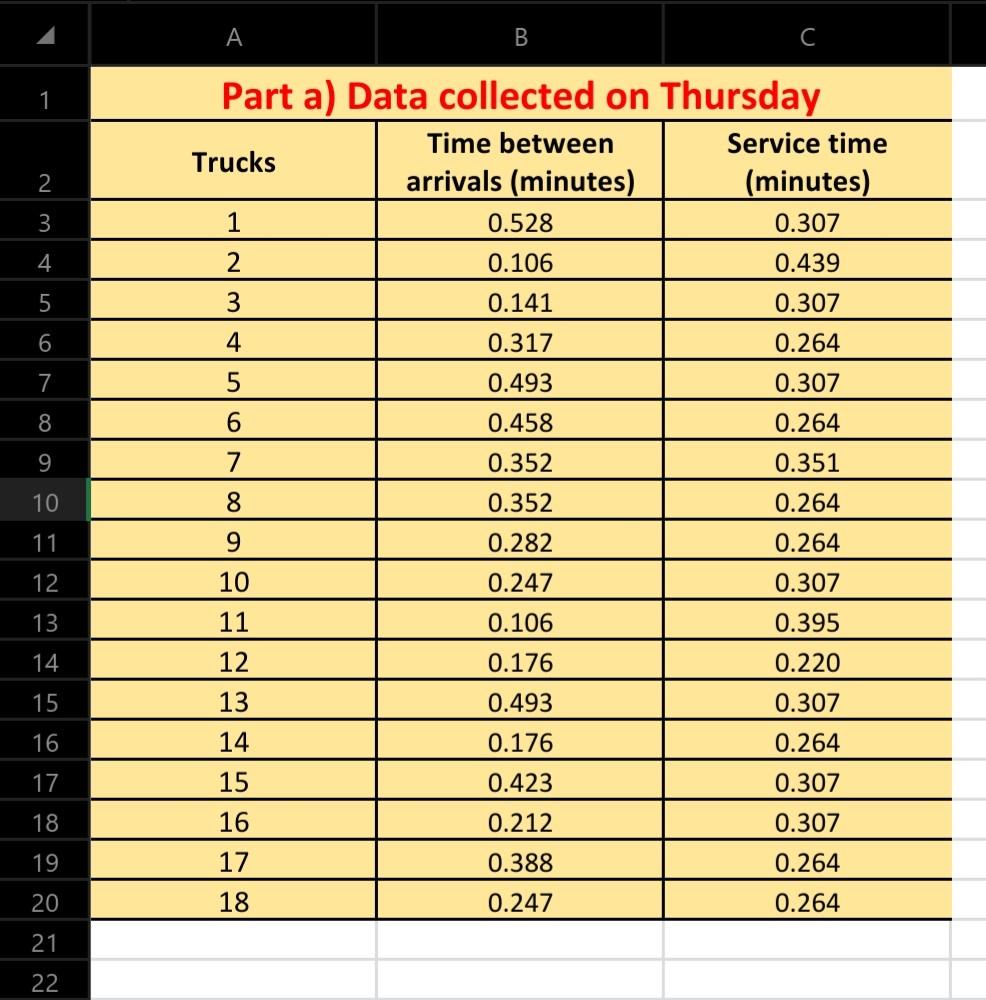
Consider the queueing problem in Question 1. NOTE-1: SHOW ALL YOUR WORK. USE 4 DECIMAL PLACES IN ALL CALCULATIONS. a) Data was collected on the same queueing system on Thursday. The data is available in the Excel file. i. (1 point) What is the main difference between the data for this problem and the data in part a of Question 1? ii. (1 point) Compute the a, p, CVa, CVp for this queueing system. Use minutes as your time unit. iii. (6 points) Compute the average number of trucks in the queue, average number of trucks in the system, average number of trucks being served, average utilization rate of a server, average wait time in the queue (in minutes) per truck, average time spent in the system (in minutes) per truck, and average service time (in minutes) per truck. You must show all the work you do as you calculate each value. You can also provide screenshots of any work you do in Excel. Make sure you include all inputs and outputs in your screenshot. After you complete the work, add your answers to the table below: iv. (1 point) Compare the queuing performance in parts a, b, c of Question 1 to part a of Question 2. What is the effect of increase in utilization rate of servers on wait times? b) (1 point) Explain clearly why high utilization rates have a significant impact on the queueing performance
Step by Step Solution
There are 3 Steps involved in it

Get step-by-step solutions from verified subject matter experts