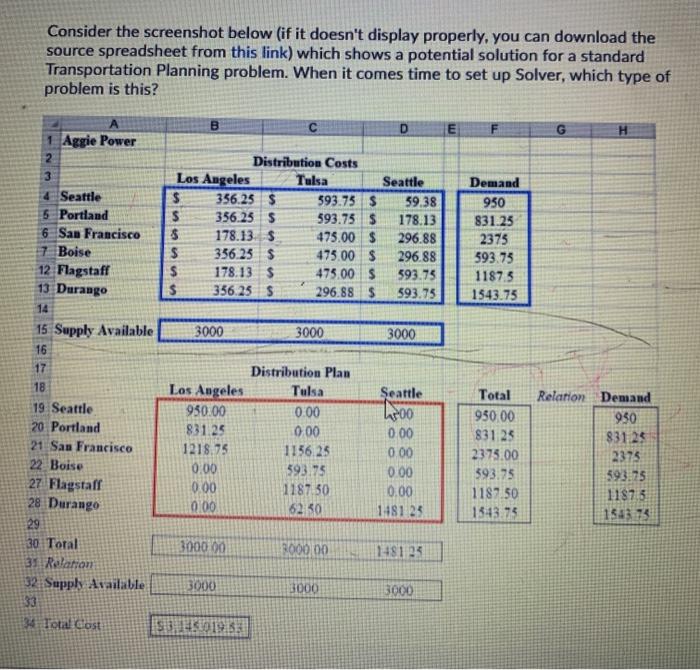
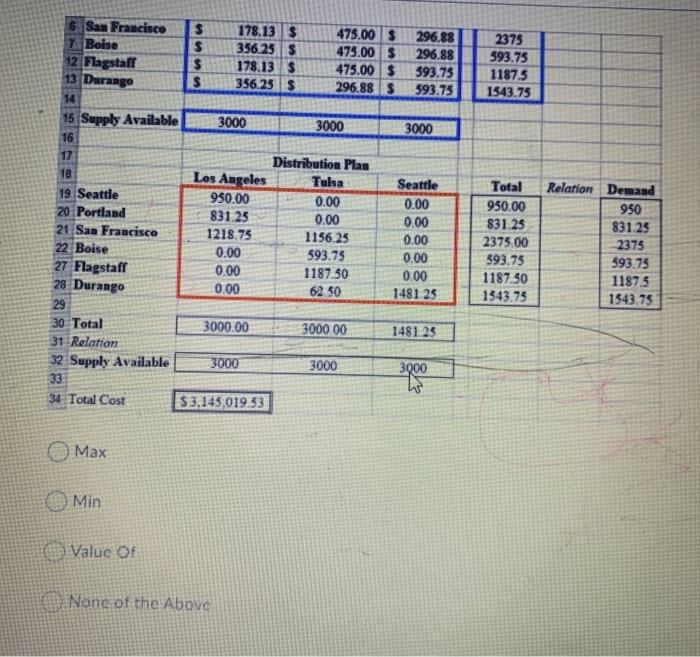
Question: Consider the screenshot below (if it doesn't display properly, you can download the source spreadsheet from this link) which shows a potential solution for a

Consider the screenshot below (if it doesn't
Consider the screenshot below (if it doesn't display properly, you can download the source spreadsheet from this link) which shows a potential solution for a standard Transportation Planning problem. When it comes time to set up Solver, which type of problem is this? H Demand 950 831.25 2375 593.75 1187.5 1543.75 D 1 Aggie Power 2 Distribution Costs 3 Los Angeles Tulsa Seattle 4 Seattle $ 356.25 $ 593.73 $ 59.38 5 Portland $ 356.25 $ 593.75 $ 178.13 6 San Francisco $ 178.13 $ 475.00 $ 296.88 7 Boise $ 356.23 $ 475.00 $ 296.88 12 Flagstaff $ 178.13 $ 475.00 $ 593.75 13 Durango $ 356.25$ 296.88 $ 593.75 14 15 Supply Available 3000 3000 3000 16 17 Distribution Plan 18 Los Angeles Tulsa Seattle 19 Seattle 950.00 0.00 Foo 20 Portland 831.25 0.00 0.00 21 San Francisco 1218.75 115625 0.00 22 Boise 0.00 593.75 0.00 27 Flagstaff 0.00 1187.50 0.00 28 Durango 0.00 62.50 1481 23 29 30 Total 3000 00 3000.00 148123 31 Relation 32. Supply Available 3000 3000 3000 33 34 Total Cost S0196 Total 950.00 831 23 2375.00 393.75 1187.50 1343.73 Relation Demand 950 83125 23.75 593.75 11875 1543.73 2375 593.75 1187.5 1543.75 6 San Francisco $ 178.13 $ 475.00 $ 296.88 7 Boise $ 356.25 $ 475.00 $ 296.88 12 Flagstaff $ 178.13 $ 475.00 $ 593.75 13 Durango $ 356.25$ 296.885 393.75 14 16 Supply Available 3000 3000 3000 16 17 Distribution Plan 18 Los Angeles Tulsa Seattle 19 Seattle 950.00 0.00 0.00 20 Portland 831.25 0.00 0.00 21 San Francisco 1218.75 1156.25 0.00 22 Boise 0.00 593.75 0.00 27 Flagstaff 0.00 1187.50 0.00 28 Durango 0.00 62 50 1481.25 29 30 Total 3000.00 3000 00 1481 25 31 Relation 32 Supply Available 3000 3000 3000 33 34 Total Cost $3,145,019.53 Total 950.00 831.25 2375:00 593.75 1187.50 1543.75 Relation Demand 950 831.25 2375 393.75 11875 1943.75 Max O Min Value of None of the Above Question 14 (2 points) Consider the Constraint portion of the Sensitivity Report given below: Constraint 1 2 Final Shadow Constraint Allowable Allowable Value Price R.H. Side Increase Decrease 100 0 90 1E+30 3.25 30 50 9.00 2.75 75 17 20 9.25 2.75 10 o 150 4.00 1E+30 50 18 2.00 5.75 3 4 5 60 By how much can the Right Hand Side of Constraint 5 increase before the Shadow Price of 18 no longer applies? Your

Step by Step Solution

There are 3 Steps involved in it

1 Expert Approved Answer
Step: 1 Unlock blur-text-image
Question Has Been Solved by an Expert!

Get step-by-step solutions from verified subject matter experts

Step: 2 Unlock
Step: 3 Unlock

Students Have Also Explored These Related General Management Questions!