

Question: . Consider the table below, where x is a predictor and y is response variable. X y 1. Using Stochastic Gradient Descent, find the hypothesis
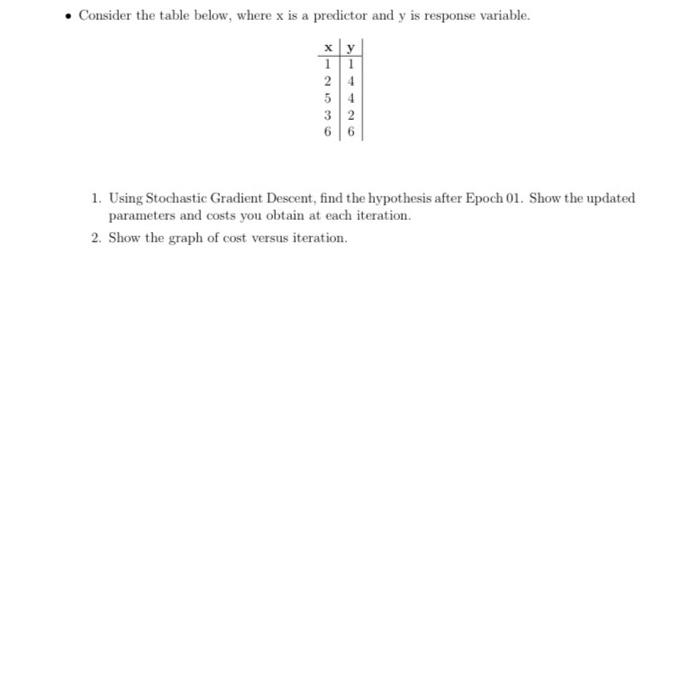

. Consider the table below, where x is a predictor and y is response variable. X y 1. Using Stochastic Gradient Descent, find the hypothesis after Epoch 01. Show the updated parameters and costs you obtain at each iteration. 2. Show the graph of cost versus iteration
Step by Step Solution
There are 3 Steps involved in it
1 Expert Approved Answer
Step: 1 Unlock

Question Has Been Solved by an Expert!
Get step-by-step solutions from verified subject matter experts
Step: 2 Unlock
Step: 3 Unlock