Question: Consider the table of output data generated by simulating various scenarios for the pain clinic. This information is provided as MillerData.xlsx. Use this data to
Consider the table of output data generated by simulating various scenarios for the pain clinic. This information is provided as MillerData.xlsx. Use this data to supplement the information written in the case to consider the following issues. 1. Describe the linkage between patient punctuality and clinic performance. Is patient punctuality a serious problem in this clinic? Why or why not? 2. Describe the linkage between teaching time and clinic performance. Is this a serious problem in this clinic? Why or why not? 3. Does the teaching mission of the clinic make the patient experience better or worse? 4. Using the data and results provided, make your best argument that preprocessing is best for the patients, and/or attending physicians, and/or trainees. 5. How would you go about getting other attendings to implement a preprocessing protocol? Use PowerPoint to create three slides that you will use in a presentation to get other attendings to adoptthe preprocessing polic
Case study.
http://pubsonline.informs.org/journal/ited/ ISSN 1532-0545 (online) Case Miller Pain Treatment Center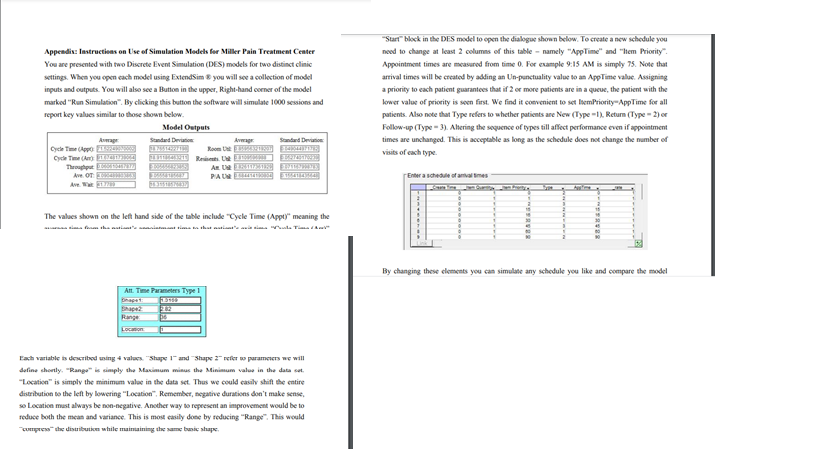
Appendis: Instructions on Use of Simulation Models for Miller Pain Treatment Center You are presented with two Discrete Event Simulation (DES) models for two distinct clinic settings. When you open cach model using ExtendSim & you will see a collection of model inputs and outputs. You will also see a Button in the upper, Right-hand comer of the model marked "Run Simulation". By clicking this button the software will simulate 1000 sessions and report key values similar to those shown below. Model Outputs Apr Sandard Deviation Cycle Time) AU PE Ave. OT PANELS "Start" block in the DES model to open the dialogue shown below. To create a new schedule you need to change at least 2 columns of this table-namely "AppTime" and "Hem Priority Appointment times are measured from time 0. For example 9:15 AM is simply 75. Note that arrival times will be created by adding an Un-punctuality value to an App Time value. Assigning a priority to each patient guarantees that if if 2 or more patients are in a queue, the patient with the lower value of priority is seen first. We find it convenient to setemPriority-App Time for all patients. Also note that Type refers to whether patients are New (Type -1). Return (Type - 2) Follow-up (Type-3). Altering the sequence of types till affect performance even if appointment times are unchanged. This is acceptable as long as the schedule does not change the number of visits of each type Enter a schedule of avoimes 19 The values shown on the left hand side of the table include "Cycle Time (Appt)" meaning the is that TV 30 45 * 1 . By changing these clements you can simulate any schedule you like and compare the model Art. Time Parameters Type 1 Location Each variable is described using values. "Shape and Shape refer o parameters we will define shortly. "Range" is simply the Maximum minus the Minimum value in the dataset, "Location is simply the minimum value in the data set. Thus we could easily shift the entire distribution to the left by lowering "Location". Remember, negative durations don't make sense so Location must always be non-negative. Another way to represent an improvement would be to reduce both the man and variance. This is most casily done by reducing "Range". This would che distribution while maintaining the same and shape Appendis: Instructions on Use of Simulation Models for Miller Pain Treatment Center You are presented with two Discrete Event Simulation (DES) models for two distinct clinic settings. When you open cach model using ExtendSim & you will see a collection of model inputs and outputs. You will also see a Button in the upper, Right-hand comer of the model marked "Run Simulation". By clicking this button the software will simulate 1000 sessions and report key values similar to those shown below. Model Outputs Apr Sandard Deviation Cycle Time) AU PE Ave. OT PANELS "Start" block in the DES model to open the dialogue shown below. To create a new schedule you need to change at least 2 columns of this table-namely "AppTime" and "Hem Priority Appointment times are measured from time 0. For example 9:15 AM is simply 75. Note that arrival times will be created by adding an Un-punctuality value to an App Time value. Assigning a priority to each patient guarantees that if if 2 or more patients are in a queue, the patient with the lower value of priority is seen first. We find it convenient to setemPriority-App Time for all patients. Also note that Type refers to whether patients are New (Type -1). Return (Type - 2) Follow-up (Type-3). Altering the sequence of types till affect performance even if appointment times are unchanged. This is acceptable as long as the schedule does not change the number of visits of each type Enter a schedule of avoimes 19 The values shown on the left hand side of the table include "Cycle Time (Appt)" meaning the is that TV 30 45 * 1 . By changing these clements you can simulate any schedule you like and compare the model Art. Time Parameters Type 1 Location Each variable is described using values. "Shape and Shape refer o parameters we will define shortly. "Range" is simply the Maximum minus the Minimum value in the dataset, "Location is simply the minimum value in the data set. Thus we could easily shift the entire distribution to the left by lowering "Location". Remember, negative durations don't make sense so Location must always be non-negative. Another way to represent an improvement would be to reduce both the man and variance. This is most casily done by reducing "Range". This would che distribution while maintaining the same and shape


