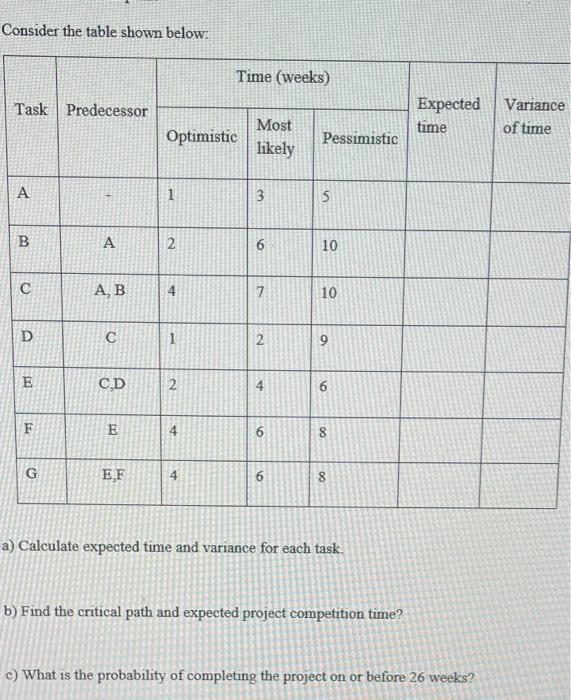
Question: Consider the table shown below: Time (weeks) Task Predecessor Expected Variance of time time Optimistic Most likely Pessimistic A 1 3 3 5 B A

Consider the table shown below: Time (weeks) Task
Consider the table shown below: Time (weeks) Task Predecessor Expected Variance of time time Optimistic Most likely Pessimistic A 1 3 3 5 B A 2. 6 10 A, B 4 4 7 10 D 1 1 2 9 E CD 2 6 F E 4 1 00 G EF 4 6 8 a) Calculate expected time and variance for each task. b) Find the critical path and expected project competition time? c) What is the probability of completing the project on or before 26 weeks

Step by Step Solution

There are 3 Steps involved in it

1 Expert Approved Answer
Step: 1 Unlock blur-text-image
Question Has Been Solved by an Expert!

Get step-by-step solutions from verified subject matter experts

Step: 2 Unlock
Step: 3 Unlock

Students Have Also Explored These Related General Management Questions!