

Question: Consider the two diagrams below. Diagram A represents a typical firm in a purely competitive industry. Diagram B represents the supply and demand conditions
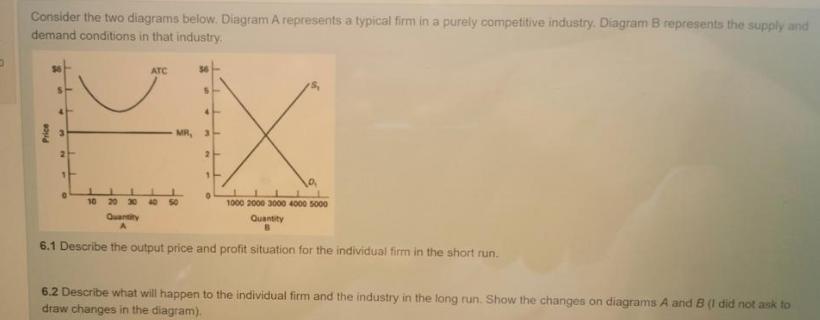
Consider the two diagrams below. Diagram A represents a typical firm in a purely competitive industry. Diagram B represents the supply and demand conditions in that industry. ATC MR, 3- 10 20 30 1000 2000 3000 4000 5000 Quantity Quantity 6.1 Describe the output price and profit situation for the individual firm in the short run. 6.2 Describe what will happen to the individual firm and the industry in the long run. Show the changes on diagrams A and B (I did not ask to draw changes in the diagram). Price
Step by Step Solution
3.46 Rating (159 Votes )
There are 3 Steps involved in it
To address the questions lets analyze the diagrams Diagram Analysis Diagram A This shows the cost cu... View full answer

Get step-by-step solutions from verified subject matter experts