

Question: Consider this training data set shown in the following table. Examples are A-E, and the single attribute is X. Example A B D E Attribute
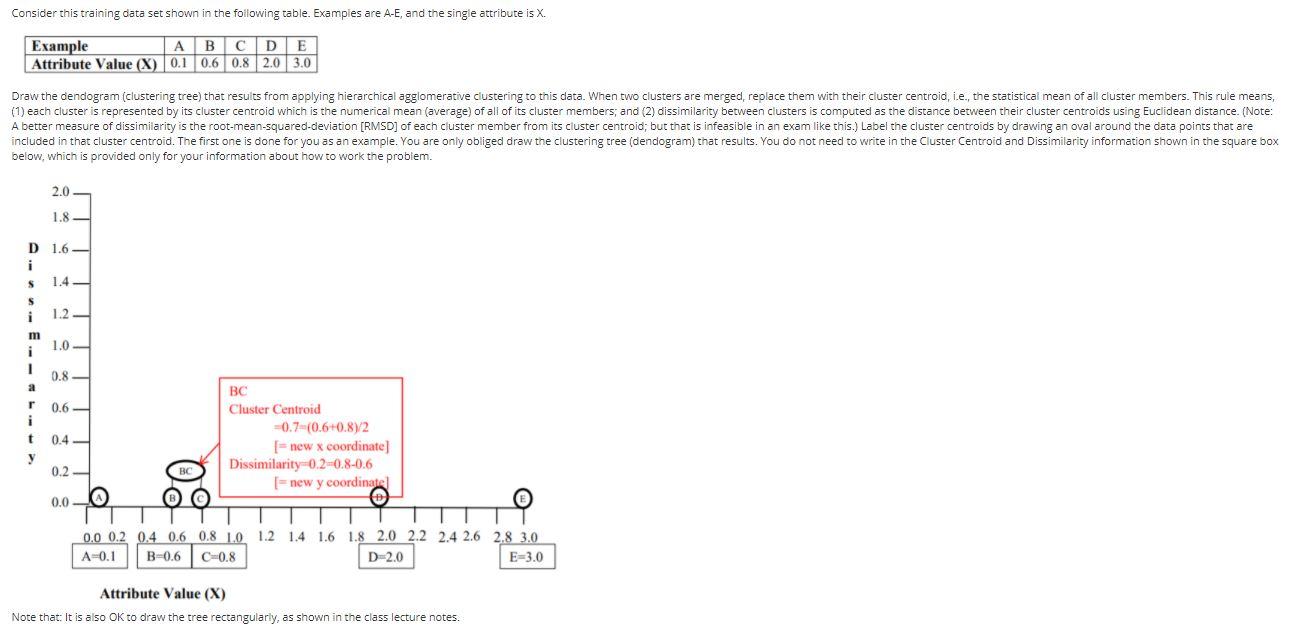
Consider this training data set shown in the following table. Examples are A-E, and the single attribute is X. Example A B D E Attribute Value (X) 0.1 0.6 0.8 2.0 3.0 Draw the dendogram (clustering tree) that results from applying hierarchical agglomerative clustering to this data. When two clusters are merged, replace them with their cluster centroid, i.e., the statistical mean of all cluster members. This rule means, (1) each cluster is represented by its cluster centroid which is the numerical mean (average) of all of its cluster members; and (2) dissimilarity between clusters is computed as the distance between their cluster centroids using Euclidean distance. (Note: A better measure of dissimilarity is the root-mean-squared-deviation (RMSD) of each cluster member from its cluster centroid; but that is infeasible in an exam like this.) Label the cluster centroids by drawing an oval around the data points that are included in that cluster centroid. The first one is done for you as an example. You are only obliged draw the clustering tree (dendogram) that results. You do not need to write in the Cluster Centroid and Dissimilarity information shown in the square box below, which is provided only for your information about how to work the problem. 2.0 1.8 D 1.6 - i S S i 1.2 - m 1.0 1 a 0.8 r i 0.6 t 0.4 BC Cluster Centroid -0.7 (0.6 0.872 = new x coordinate] Dissimilarity -0.2-0,8-0.6 new y coordinatel 0.2- 08 0.0 0.0 0.2 0.4 0.6 0.8 LO 1.2 1.4 1.6 1.8 2.0 2.2 2.4 2.6 2.8 3.0 A-0.1 B-0.6 C-0.8 D-2.0 E=3.0 Attribute Value (X) Note that: It is also OK to draw the tree rectangularly, as shown in the class lecture notes. Consider this training data set shown in the following table. Examples are A-E, and the single attribute is X. Example A B D E Attribute Value (X) 0.1 0.6 0.8 2.0 3.0 Draw the dendogram (clustering tree) that results from applying hierarchical agglomerative clustering to this data. When two clusters are merged, replace them with their cluster centroid, i.e., the statistical mean of all cluster members. This rule means, (1) each cluster is represented by its cluster centroid which is the numerical mean (average) of all of its cluster members; and (2) dissimilarity between clusters is computed as the distance between their cluster centroids using Euclidean distance. (Note: A better measure of dissimilarity is the root-mean-squared-deviation (RMSD) of each cluster member from its cluster centroid; but that is infeasible in an exam like this.) Label the cluster centroids by drawing an oval around the data points that are included in that cluster centroid. The first one is done for you as an example. You are only obliged draw the clustering tree (dendogram) that results. You do not need to write in the Cluster Centroid and Dissimilarity information shown in the square box below, which is provided only for your information about how to work the problem. 2.0 1.8 D 1.6 - i S S i 1.2 - m 1.0 1 a 0.8 r i 0.6 t 0.4 BC Cluster Centroid -0.7 (0.6 0.872 = new x coordinate] Dissimilarity -0.2-0,8-0.6 new y coordinatel 0.2- 08 0.0 0.0 0.2 0.4 0.6 0.8 LO 1.2 1.4 1.6 1.8 2.0 2.2 2.4 2.6 2.8 3.0 A-0.1 B-0.6 C-0.8 D-2.0 E=3.0 Attribute Value (X) Note that: It is also OK to draw the tree rectangularly, as shown in the class lecture notes
Step by Step Solution
There are 3 Steps involved in it

Get step-by-step solutions from verified subject matter experts