

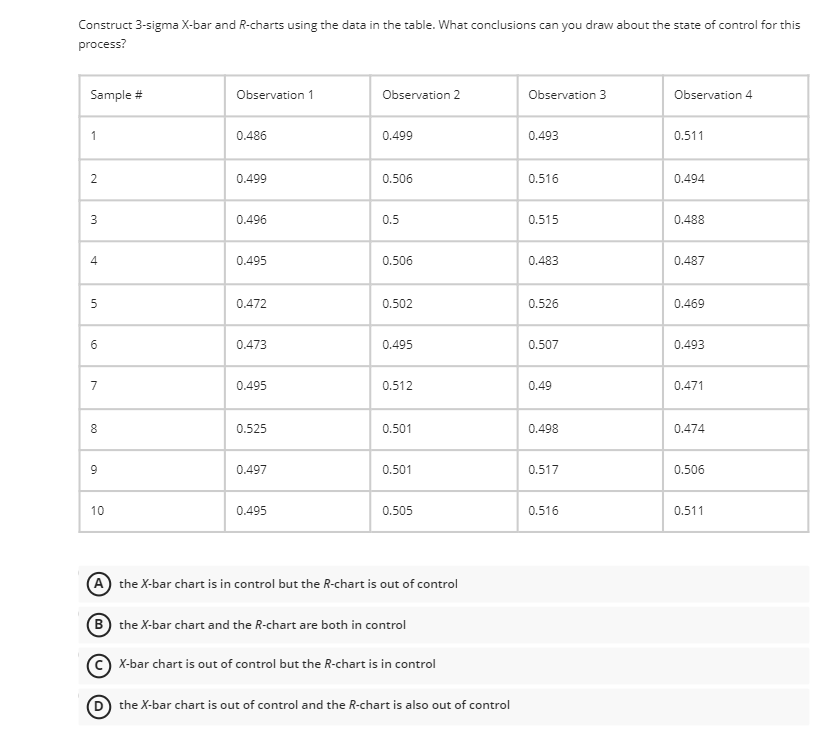
Question: Construct 3-sigma X-bar and R-charts using the data in the table. What conclusions can you draw about the state of control for this process? Sample
Step by Step Solution
There are 3 Steps involved in it
1 Expert Approved Answer
Step: 1 Unlock

Question Has Been Solved by an Expert!
Get step-by-step solutions from verified subject matter experts
Step: 2 Unlock
Step: 3 Unlock