

Question: are these correct? Size of Sample (n) 2 3 Factor for UCL Factor for Factor for UCL for and LCL for x-bar-Charts LCL for R-Charts
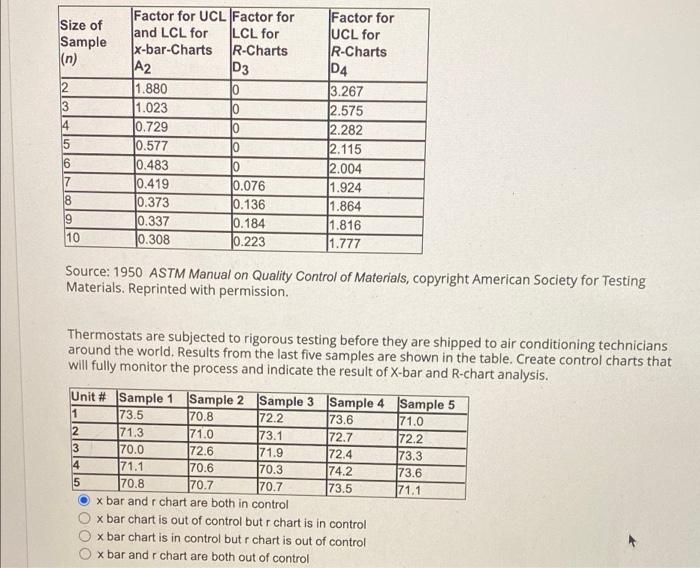
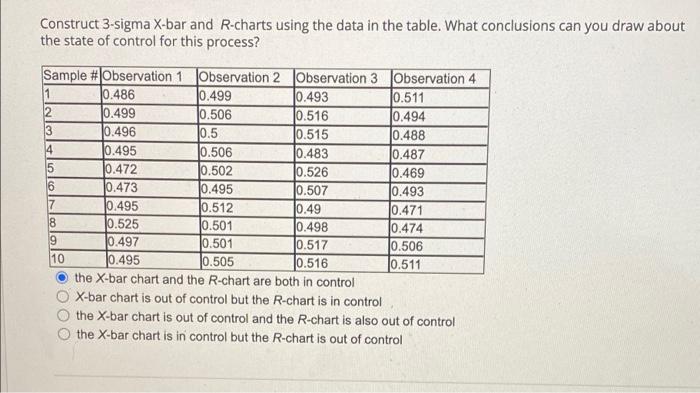
Size of Sample (n) 2 3 Factor for UCL Factor for Factor for UCL for and LCL for x-bar-Charts LCL for R-Charts R-Charts A2 D3 D4 1.880 10 3.267 1.023 10 2.575 0.729 10 2.282 0.577 10 2.115 0.483 10 2.004 0.419 0.076 1.924 0.373 0.136 1.864 0.337 0.184 1.816 10 0.308 0.223 1.777 Source: 1950 ASTM Manual on Quality Control of Materials, copyright American Society for Testing Materials. Reprinted with permission. Thermostats are subjected to rigorous testing before they are shipped to air conditioning technicians around the world. Results from the last five samples are shown in the table. Create control charts that will fully monitor the process and indicate the result of X-bar and R-chart analysis. Unit # Sample 1 Sample 2 Sample 3 Sample 4 Sample 5 71.0 1 73.5 70.8 72.2 73.6 71.3 71.0 73.1 72.7 72.2 70.0 72.6 71.9 72.4 73.3 71.1 70.6 70.3 74.2 73.6 70.8 70.7 70.7 73.5 71.1 x bar and r chart are both in control x bar chart is out of control but r chart is in control x bar chart is in control but r chart is out of control x bar and r chart are both out of control 14 15 6 7 9 2 3 45 000 Construct 3-sigma X-bar and R-charts using the data in the table. What conclusions can you draw about the state of control for this process? Sample #Observation 1 Observation 2 Observation 3 Observation 4 1 0.486 0.499 0.493 0.511 0.499 0.506 0.516 0.494 0.496 0.5 0.515 0.488 0.495 0.506 0.483 0.487 0.472 0.502 0.526 0.469 0.473 0.495 0.507 0.493 0.495 0.512 0.49 0.471 0.525 0.501 0.498 0.474 0.497 0.501 0.517 0.506 10 0.495 0.505 0.516 0.511 the X-bar chart and the R-chart are both in control X-bar chart is out of control but the R-chart is in control the X-bar chart is out of control and the R-chart is also out of control the X-bar chart is in control but the R-chart is out of control 3 4 5 6 8 9
Step by Step Solution
There are 3 Steps involved in it

Get step-by-step solutions from verified subject matter experts