

Question: construct a basic cash flow and sales adjustment grid for a property. This is the model that you will build on for your Case Study.
construct a basic cash flow and sales adjustment grid for a property. This is the model that you will build on for your Case Study. Therefore, if you have any inputs like rents and expenses feel free to start integrating them into the operating statement model. I want you to focus on the structure of your model and coding in excel. As for the sales adjustment grid utilize the basic structure that was presented earlier in class with the transaction level adjustments first and property level adjustments second. Please help me construct this model in excel.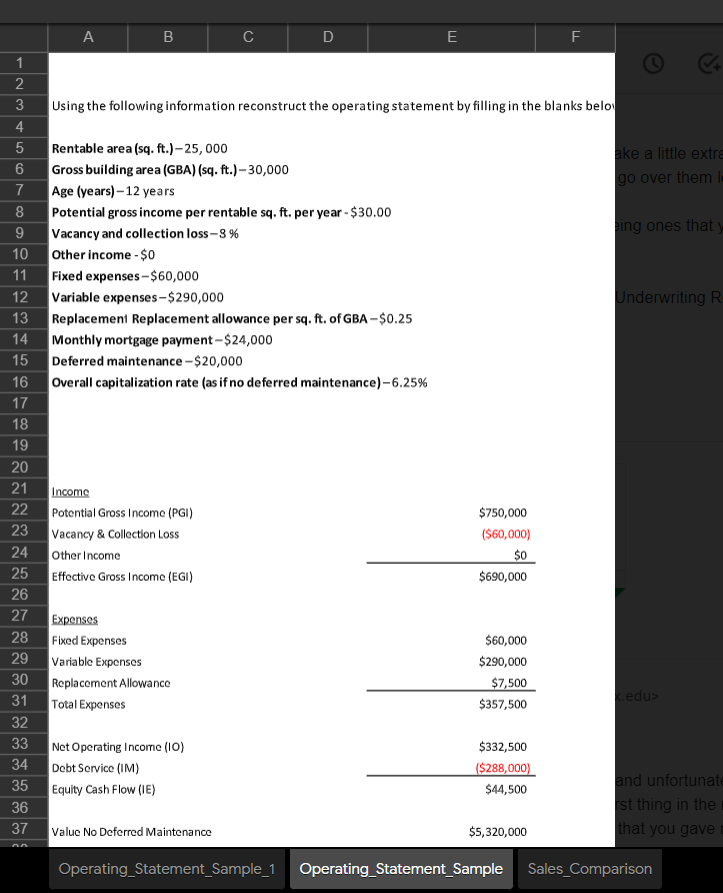
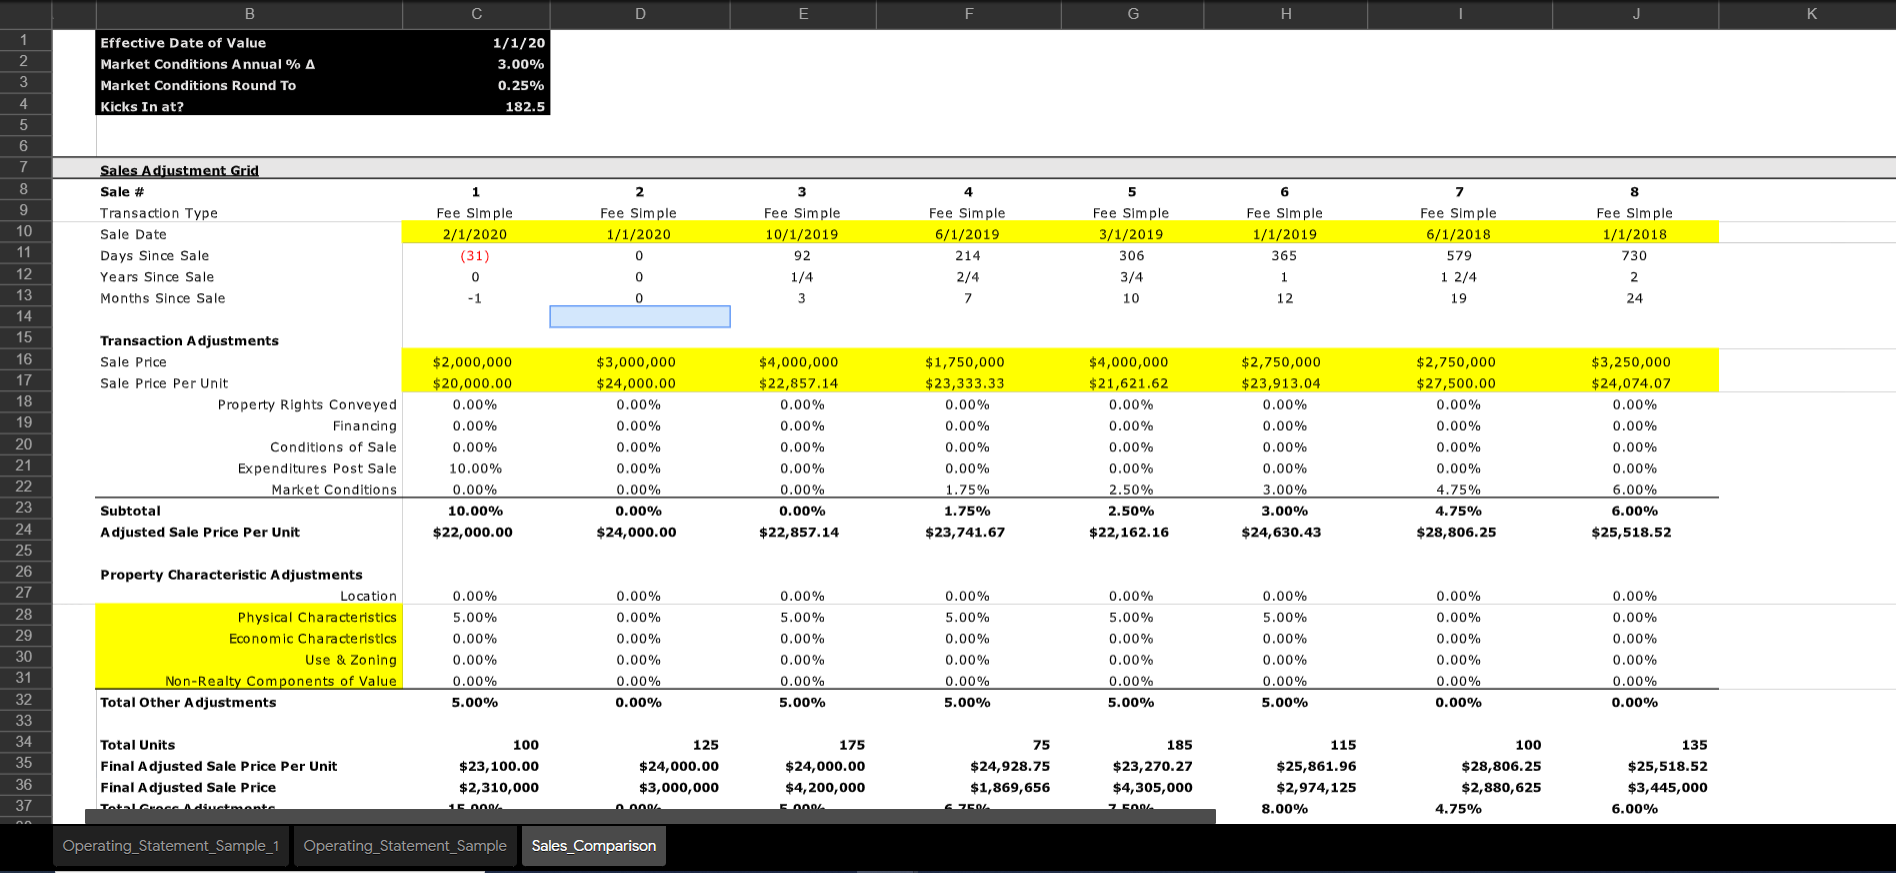
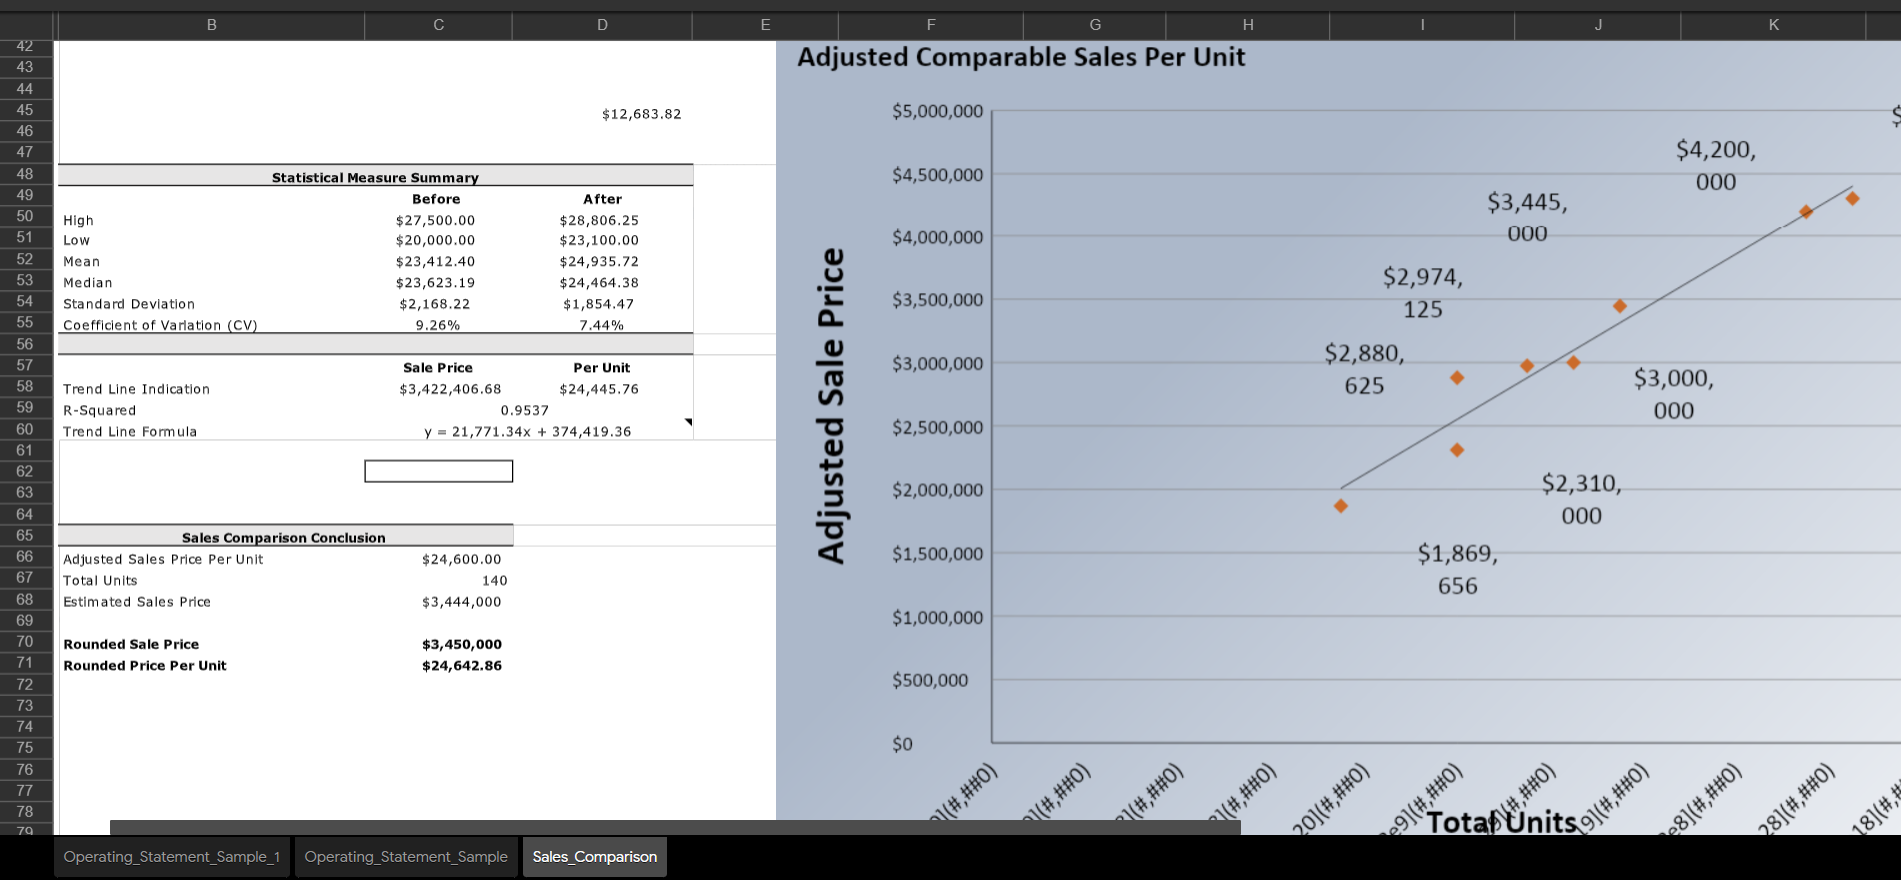
B D E F Using the following information reconstruct the operating statement by filling in the blanks belo ake a little extra go over them ing ones that Rentable area (sq. ft.) -25,000 Gross building area (GBA) (sq. ft.) 30,000 Age (years) 12 years Potential gross income per rentable sq.ft. per year - $30.00 Vacancy and collection loss-8% Other income - $0 Fixed expenses - $60,000 Variable expenses -$290,000 Replacement Replacement allowance per sq. ft. of GBA -$0.25 Monthly mortgage payment-$24,000 Deferred maintenance - $ 20,000 Overall capitalization rate (as if no deferred maintenance) -6.25% Underwriting R 1 2 3 4 5 6 7 8 9 10 11 12 13 14 15 16 17 18 19 20 21 22 23 24 25 26 27 28 29 30 31 32 33 34 35 36 37 Income Potential Gross Incomc (PGI) Vacancy & Collection Loss Other Income Effective Gross Income (EGI) $750,000 ($60,000) $0 $690,000 Expenses Fixed Expenses Variable Expenses Replacement Allowance Total Expenses $60,000 $290,000 $7,500 $357,500 Ledus Net Operating Income (10) Debt Service (IM) Equity Cash Flow (IE) $332,500 ($288,000) $44,500 and unfortunat st thing in the that you gave Value No Deferred Maintenance $5,320,000 Operating_Statement_Sample_1 Operating_Statement_Sample Sales Comparison C D E G . K 2 Effective Date of Value Market Conditions Annual % A Market Conditions Round To Kicks In at? 1/1/20 3.00% 0.25% 182.5 3 4 5 6 7 8 1 2 3 5 8 Sales Adiustment Grid Sale # Transaction Type Sale Date Days Since Sale Years Since Sale Months Since Sale Fee Simple 1/1/2020 Fee Simple 2/1/2020 (31) 0 4 Fee Simple 6/1/2019 214 2/4 7 Fee Simple 10/1/2019 92 1/4 3 Fee Simple 3/1/2019 306 3/4 6 Fee Simple 1/1/2019 365 7 Fee Simple 6/1/2018 579 1 2/4 19 Fee Simple 1/1/2018 730 0 0 1 2 -1 0 10 12 24 9 10 11 12 13 14 15 16 17 18 19 20 21 22 23 24 25 26 27 28 29 30 31 32 33 34 35 36 37 Transaction Adjustments Sale Price Sale Price Per Unit Property Rights Conveyed Financing Conditions of Sale Expenditures Post Sale Market Conditions Subtotal Adjusted Sale Price Per Unit $2,000,000 $20,000.00 0.00% 0.00% 0.00% 10.00% 0.00% 10.00% $22,000.00 $3,000,000 $24,000.00 0.00% 0.00% 0.00% 0.00% 0.00% 0.00% $ 24,000.00 $4,000,000 $22,857.14 0.00% 0.00% 0.00% 0.00% 0.00% 0.00% $22,857.14 $1,750,000 $23,333.33 0.00% 0.00% 0.00% 0.00% 1.75% 1.75% $23,741.67 $4,000,000 $21,621.62 0.00% 0.00% 0.00% 0.00% 2.50% 2.50% $22,162.16 $2,750,000 $23,913.04 0.00% 0.00% 0.00% 0.00% 3.00% 3.00% $24,630.43 $2,750,000 $ 27,500.00 0.00% 0.00% 0.00% 0.00% 4.75% 4.75% $28,806.25 $3,250,000 $24,074.07 0.00% 0.00% 0.00% 0.00% 6.00% 6.00% $25,518.52 Property Characteristic Adjustments Location Physical Characteristics Economic Characteristics Use & Zoning Non-Realty Components of Value Total Other Adjustments 0.00% 5.00% 0.00% 0.00% 0.00% 5.00% 0.00% 0.00% 0.00% 0.00% 0.00% 0.00% 0.00% 5.00% 0.00% 0.00% 0.00% 0.00% 5.00% 0.00% 0.00% 0.00% 0.00% 5.00% 0.00% 0.00% 0.00% 5.00% 0.00% 5.00% 0.00% 0.00% 0.00% 5.00% 0.00% 0.00% 0.00% 0.00% 0.00% 0.00% 0.00% 0.00% 0.00% 0.00% 0.00% 5.00% 5.00% 0.00% 115 135 Total Units Final Adjusted Sale Price Per Unit Final Adjusted Sale Price Totale diwatonta 100 $23,100.00 $2,310,000 1000/ 125 $24,000.00 $3,000,000 nnnn 175 $24,000.00 $4,200,000 Enno 75 $24,928.75 $1,869,656 750 185 $23,270.27 $4,305,000 7 500 $25,861.96 $2,974, 125 8.00% 100 $28,806.25 $2,880,625 4.75% $25,518.52 $3,445,000 6.00% Operating_Statement_Sample_1 Operating_Statement_Sample Sales Comparison Totaf Units g](#,##0) B D E G H K 42 Adjusted Comparable Sales Per Unit $12,683.82 $5,000,000 $4,200, 000 $4,500,000 High $3,445, 000 LOW $4,000,000 Statistical Measure Summary Before $27,500.00 $ 20,000.00 $23,412.40 $23,623.19 $2,168.22 9.26% Mean Median Standard Deviation Coefficient of Variation (CV) After $28,806.25 $23,100.00 $24,935.72 $24,464.38 $1,854.47 7.44% $3,500,000 $2,974, 125 $3,000,000 $2,880, 625 43 44 45 46 47 48 49 50 51 52 53 54 55 56 57 58 59 60 61 62 63 64 65 66 67 68 69 70 71 72 73 74 Trend Line Indication R-Squared Trend Line Formula Sale Price Per Unit $3,422,406.68 $24,445.76 0.9537 y = 21,771.34x + 374,419.36 Adjusted Sale Price $3,000, 000 $2,500,000 $2,000,000 $2,310, 000 $1,500,000 Sales Comparison Conclusion Adjusted Sales Price Per Unit Total Units Estimated Sales Price $24,600.00 140 $3,444,000 $1,869, 656 $1,000,000 Rounded Sale Price Rounded Price Per Unit $3,450,000 $24,642.86 $500,000 $0 75 76 77 78 (O###) #,##0) 8](#,##0) V8](#,##0) 79 (#,##0) (#,##0) *l(#,##0) 20](#,##0) e9](#,##0) 18](#,# Operating_Statement_Sample_1 Operating_Statement_Sample Sales Comparison B D E F Using the following information reconstruct the operating statement by filling in the blanks belo ake a little extra go over them ing ones that Rentable area (sq. ft.) -25,000 Gross building area (GBA) (sq. ft.) 30,000 Age (years) 12 years Potential gross income per rentable sq.ft. per year - $30.00 Vacancy and collection loss-8% Other income - $0 Fixed expenses - $60,000 Variable expenses -$290,000 Replacement Replacement allowance per sq. ft. of GBA -$0.25 Monthly mortgage payment-$24,000 Deferred maintenance - $ 20,000 Overall capitalization rate (as if no deferred maintenance) -6.25% Underwriting R 1 2 3 4 5 6 7 8 9 10 11 12 13 14 15 16 17 18 19 20 21 22 23 24 25 26 27 28 29 30 31 32 33 34 35 36 37 Income Potential Gross Incomc (PGI) Vacancy & Collection Loss Other Income Effective Gross Income (EGI) $750,000 ($60,000) $0 $690,000 Expenses Fixed Expenses Variable Expenses Replacement Allowance Total Expenses $60,000 $290,000 $7,500 $357,500 Ledus Net Operating Income (10) Debt Service (IM) Equity Cash Flow (IE) $332,500 ($288,000) $44,500 and unfortunat st thing in the that you gave Value No Deferred Maintenance $5,320,000 Operating_Statement_Sample_1 Operating_Statement_Sample Sales Comparison C D E G . K 2 Effective Date of Value Market Conditions Annual % A Market Conditions Round To Kicks In at? 1/1/20 3.00% 0.25% 182.5 3 4 5 6 7 8 1 2 3 5 8 Sales Adiustment Grid Sale # Transaction Type Sale Date Days Since Sale Years Since Sale Months Since Sale Fee Simple 1/1/2020 Fee Simple 2/1/2020 (31) 0 4 Fee Simple 6/1/2019 214 2/4 7 Fee Simple 10/1/2019 92 1/4 3 Fee Simple 3/1/2019 306 3/4 6 Fee Simple 1/1/2019 365 7 Fee Simple 6/1/2018 579 1 2/4 19 Fee Simple 1/1/2018 730 0 0 1 2 -1 0 10 12 24 9 10 11 12 13 14 15 16 17 18 19 20 21 22 23 24 25 26 27 28 29 30 31 32 33 34 35 36 37 Transaction Adjustments Sale Price Sale Price Per Unit Property Rights Conveyed Financing Conditions of Sale Expenditures Post Sale Market Conditions Subtotal Adjusted Sale Price Per Unit $2,000,000 $20,000.00 0.00% 0.00% 0.00% 10.00% 0.00% 10.00% $22,000.00 $3,000,000 $24,000.00 0.00% 0.00% 0.00% 0.00% 0.00% 0.00% $ 24,000.00 $4,000,000 $22,857.14 0.00% 0.00% 0.00% 0.00% 0.00% 0.00% $22,857.14 $1,750,000 $23,333.33 0.00% 0.00% 0.00% 0.00% 1.75% 1.75% $23,741.67 $4,000,000 $21,621.62 0.00% 0.00% 0.00% 0.00% 2.50% 2.50% $22,162.16 $2,750,000 $23,913.04 0.00% 0.00% 0.00% 0.00% 3.00% 3.00% $24,630.43 $2,750,000 $ 27,500.00 0.00% 0.00% 0.00% 0.00% 4.75% 4.75% $28,806.25 $3,250,000 $24,074.07 0.00% 0.00% 0.00% 0.00% 6.00% 6.00% $25,518.52 Property Characteristic Adjustments Location Physical Characteristics Economic Characteristics Use & Zoning Non-Realty Components of Value Total Other Adjustments 0.00% 5.00% 0.00% 0.00% 0.00% 5.00% 0.00% 0.00% 0.00% 0.00% 0.00% 0.00% 0.00% 5.00% 0.00% 0.00% 0.00% 0.00% 5.00% 0.00% 0.00% 0.00% 0.00% 5.00% 0.00% 0.00% 0.00% 5.00% 0.00% 5.00% 0.00% 0.00% 0.00% 5.00% 0.00% 0.00% 0.00% 0.00% 0.00% 0.00% 0.00% 0.00% 0.00% 0.00% 0.00% 5.00% 5.00% 0.00% 115 135 Total Units Final Adjusted Sale Price Per Unit Final Adjusted Sale Price Totale diwatonta 100 $23,100.00 $2,310,000 1000/ 125 $24,000.00 $3,000,000 nnnn 175 $24,000.00 $4,200,000 Enno 75 $24,928.75 $1,869,656 750 185 $23,270.27 $4,305,000 7 500 $25,861.96 $2,974, 125 8.00% 100 $28,806.25 $2,880,625 4.75% $25,518.52 $3,445,000 6.00% Operating_Statement_Sample_1 Operating_Statement_Sample Sales Comparison Totaf Units g](#,##0) B D E G H K 42 Adjusted Comparable Sales Per Unit $12,683.82 $5,000,000 $4,200, 000 $4,500,000 High $3,445, 000 LOW $4,000,000 Statistical Measure Summary Before $27,500.00 $ 20,000.00 $23,412.40 $23,623.19 $2,168.22 9.26% Mean Median Standard Deviation Coefficient of Variation (CV) After $28,806.25 $23,100.00 $24,935.72 $24,464.38 $1,854.47 7.44% $3,500,000 $2,974, 125 $3,000,000 $2,880, 625 43 44 45 46 47 48 49 50 51 52 53 54 55 56 57 58 59 60 61 62 63 64 65 66 67 68 69 70 71 72 73 74 Trend Line Indication R-Squared Trend Line Formula Sale Price Per Unit $3,422,406.68 $24,445.76 0.9537 y = 21,771.34x + 374,419.36 Adjusted Sale Price $3,000, 000 $2,500,000 $2,000,000 $2,310, 000 $1,500,000 Sales Comparison Conclusion Adjusted Sales Price Per Unit Total Units Estimated Sales Price $24,600.00 140 $3,444,000 $1,869, 656 $1,000,000 Rounded Sale Price Rounded Price Per Unit $3,450,000 $24,642.86 $500,000 $0 75 76 77 78 (O###) #,##0) 8](#,##0) V8](#,##0) 79 (#,##0) (#,##0) *l(#,##0) 20](#,##0) e9](#,##0) 18](#,# Operating_Statement_Sample_1 Operating_Statement_Sample Sales Comparison
Step by Step Solution
There are 3 Steps involved in it

Get step-by-step solutions from verified subject matter experts