

Question: Construct a bear money spread using the october 165 and 170 calls. Hold the position until the options expire. Determine the profits and graph the
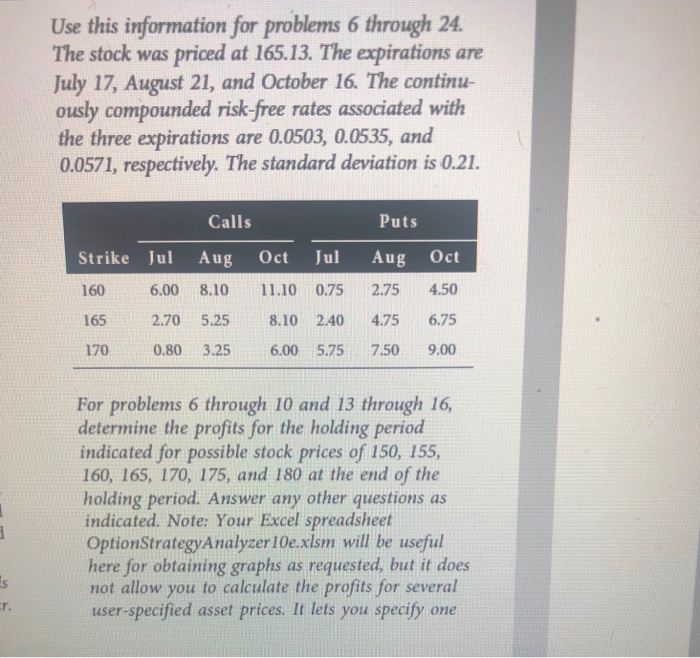
Use this information for problems 6 through 24. The stock was priced at 165.13. The expirations are July 17, August 21, and October 16. The continu- ously compounded risk-free rates associated with the three expirations are 0.0503, 0.0535, and 0.0571, respectively. The standard deviation is 0.21. Calls Strike Jul Aug Oct Jul 160 6.00 8.10 11.10 0.75 165 2.70 5.25 8.10 2.40 170 0 .80 3.25 6.00 5.75 Puts Aug Oct 2.75 4.50 4.75 6.75 7.50 9.00 For problems 6 through 10 and 13 through 16, determine the profits for the holding period indicated for possible stock prices of 150, 155, 160, 165, 170, 175, and 180 at the end of the holding period. Answer any other questions as indicated. Note: Your Excel spreadsheet OptionStrategyAnalyzer 10e.xlsm will be useful here for obtaining graphs as requested, but it does not allow you to calculate the profits for several user-specified asset prices. It lets you specify one Use this information for problems 6 through 24. The stock was priced at 165.13. The expirations are July 17, August 21, and October 16. The continu- ously compounded risk-free rates associated with the three expirations are 0.0503, 0.0535, and 0.0571, respectively. The standard deviation is 0.21. Calls Strike Jul Aug Oct Jul 160 6.00 8.10 11.10 0.75 165 2.70 5.25 8.10 2.40 170 0 .80 3.25 6.00 5.75 Puts Aug Oct 2.75 4.50 4.75 6.75 7.50 9.00 For problems 6 through 10 and 13 through 16, determine the profits for the holding period indicated for possible stock prices of 150, 155, 160, 165, 170, 175, and 180 at the end of the holding period. Answer any other questions as indicated. Note: Your Excel spreadsheet OptionStrategyAnalyzer 10e.xlsm will be useful here for obtaining graphs as requested, but it does not allow you to calculate the profits for several user-specified asset prices. It lets you specify one
Step by Step Solution
There are 3 Steps involved in it

Get step-by-step solutions from verified subject matter experts