

Question: Construct a chart of the data. What appears to happen when a new chip is introduced? Develop a causal regression model to forecast demand that
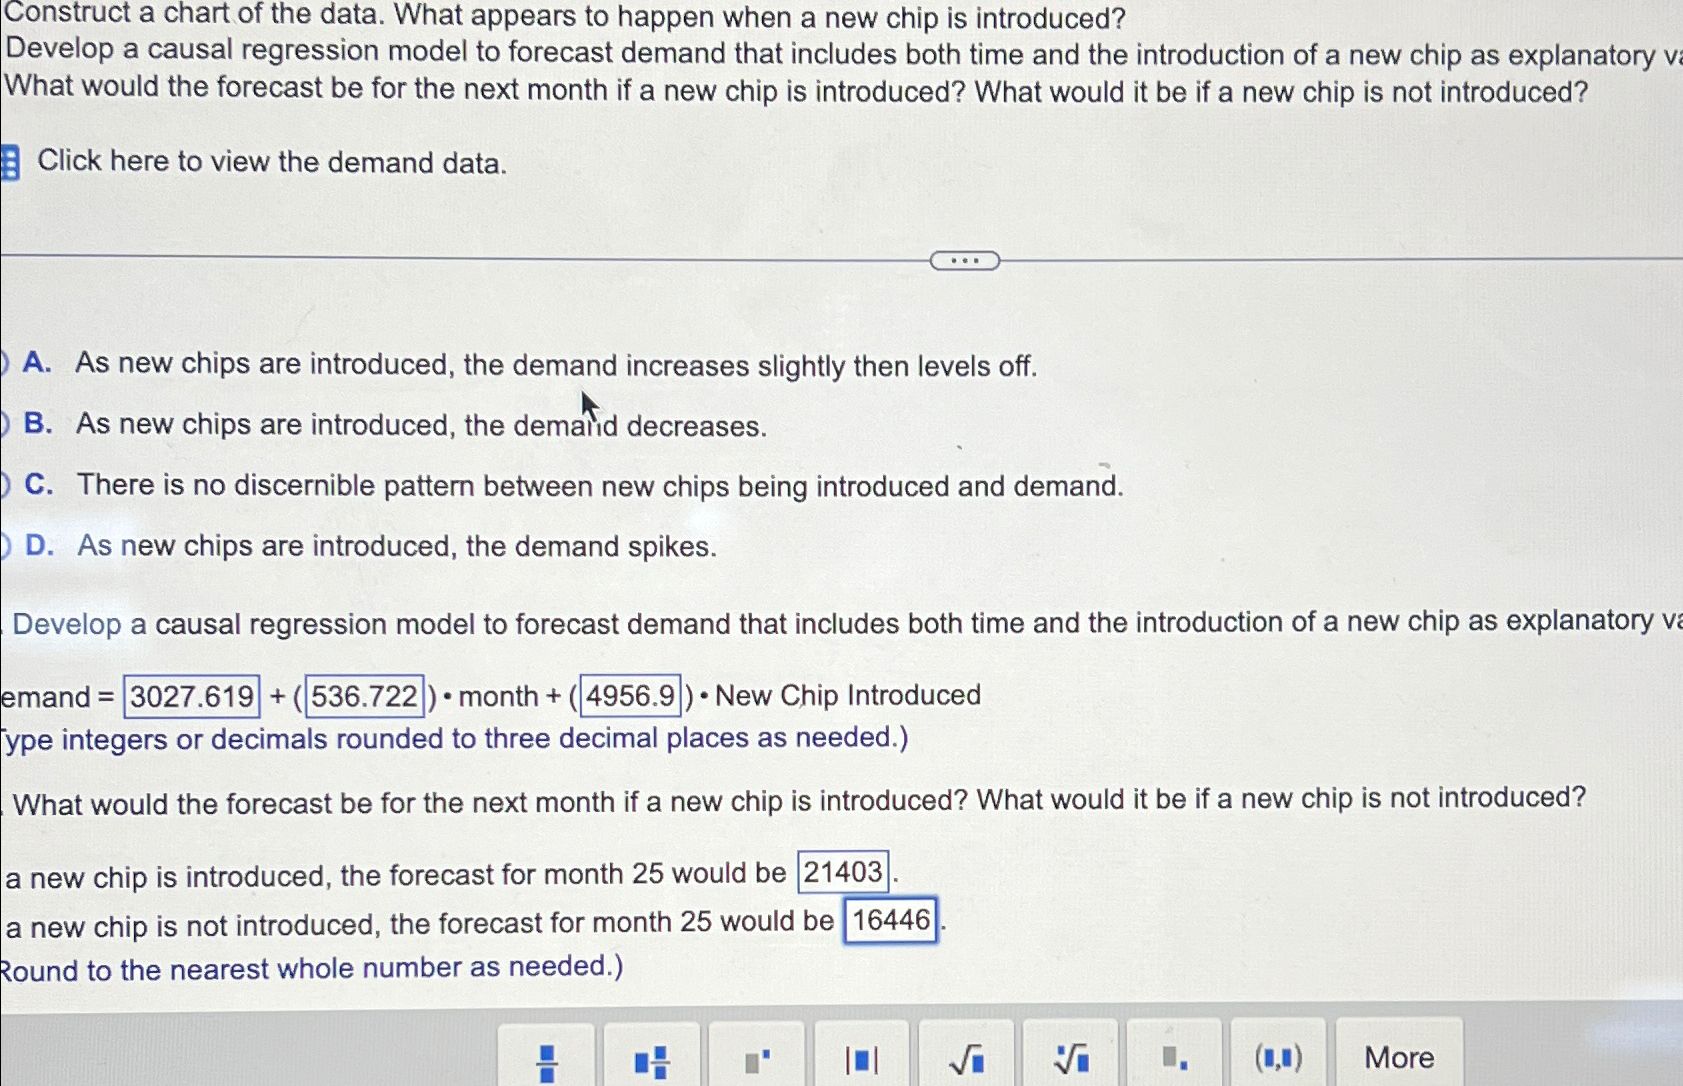
Construct a chart of the data. What appears to happen when a new chip is introduced?
Develop a causal regression model to forecast demand that includes both time and the introduction of a new chip as explanatory v What would the forecast be for the next month if a new chip is introduced? What would it be if a new chip is not introduced?
Click here to view the demand data.
A As new chips are introduced, the demand increases slightly then levels off.
B As new chips are introduced, the demalid decreases.
C There is no discernible pattern between new chips being introduced and demand.
D As new chips are introduced, the demand spikes.
Develop a causal regression model to forecast demand that includes both time and the introduction of a new chip as explanatory ve
emand month New Chip Introduced
ype integers or decimals rounded to three decimal places as needed.
What would the forecast be for the next month if a new chip is introduced? What would it be if a new chip is not introduced?
a new chip is introduced, the forecast for month would be
a new chip is not introduced, the forecast for month would be
Round to the nearest whole number as needed.
Step by Step Solution
There are 3 Steps involved in it
1 Expert Approved Answer
Step: 1 Unlock

Question Has Been Solved by an Expert!
Get step-by-step solutions from verified subject matter experts
Step: 2 Unlock
Step: 3 Unlock