

Question: Construct a data table from the information shown in the following graph (Hours of Study Time and Exam Score points). 100 80 60 60
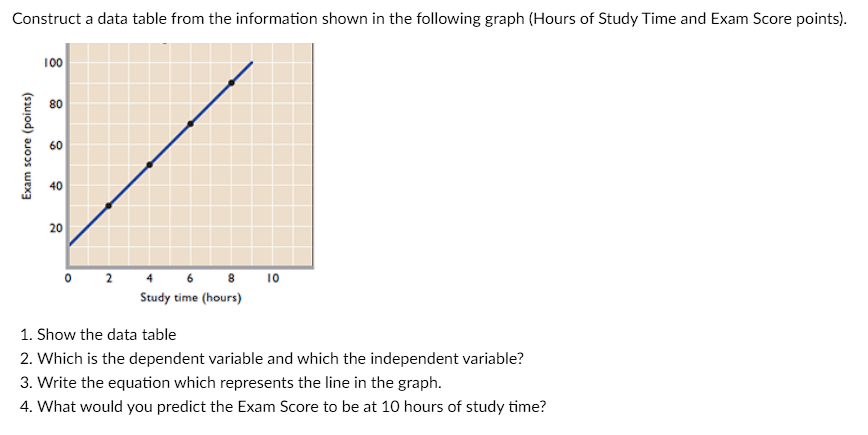
Construct a data table from the information shown in the following graph (Hours of Study Time and Exam Score points). 100 80 60 60 Exam score (points) 40 40 20 20 0 2 4 6 8 10 Study time (hours) 1. Show the data table 2. Which is the dependent variable and which the independent variable? 3. Write the equation which represents the line in the graph. 4. What would you predict the Exam Score to be at 10 hours of study time?
Step by Step Solution
There are 3 Steps involved in it
1 Expert Approved Answer
Step: 1 Unlock

Question Has Been Solved by an Expert!
Get step-by-step solutions from verified subject matter experts
Step: 2 Unlock
Step: 3 Unlock