

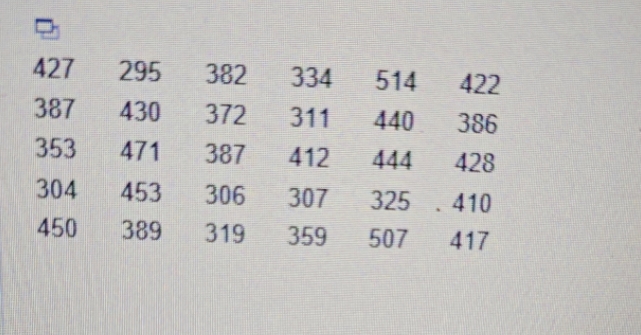
Question: Construct a frequency distribution and a frequency histogram for the data set using the indicated number of classes.Describe any patterns. Number of classes: 8Data set:
Construct a frequency distribution and a frequency histogram for the data set using the indicated number of classes.Describe any patterns. Number of classes: 8Data set: reaction time (in milliseconds) of 30 adult females to an auditory stimulus. Construct a frequency distribution of the data. Use the minimum data entry as the lower limit of the first class.
Step by Step Solution
There are 3 Steps involved in it
1 Expert Approved Answer
Step: 1 Unlock

Question Has Been Solved by an Expert!
Get step-by-step solutions from verified subject matter experts
Step: 2 Unlock
Step: 3 Unlock