

Question: Construct a frequency distribution and a frequency histogram for the data set using the indicated number of classes. Describe any patterns.Number of classes: 8Data set:

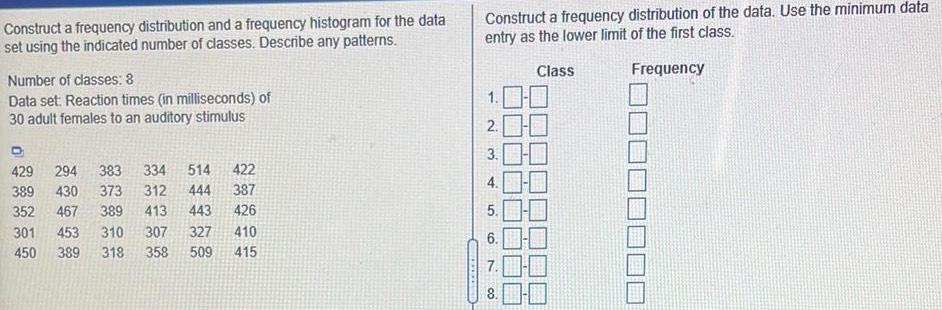
Construct a frequency distribution and a frequency histogram for the data set using the indicated number of classes. Describe any patterns.Number of classes: 8Data set: Reaction times (in milliseconds) of30 adult females to an auditory stimulus429 294 383 334 514 422389 430 373 312 444 387352 467 389 413 443 426301 453 310 307 327 410450 389 318 358 509 415Construct a frequency distribution of the data. Use the minimum data entry as the lower limit of the first class.Class Frequency
Step by Step Solution
There are 3 Steps involved in it
1 Expert Approved Answer
Step: 1 Unlock

Question Has Been Solved by an Expert!
Get step-by-step solutions from verified subject matter experts
Step: 2 Unlock
Step: 3 Unlock