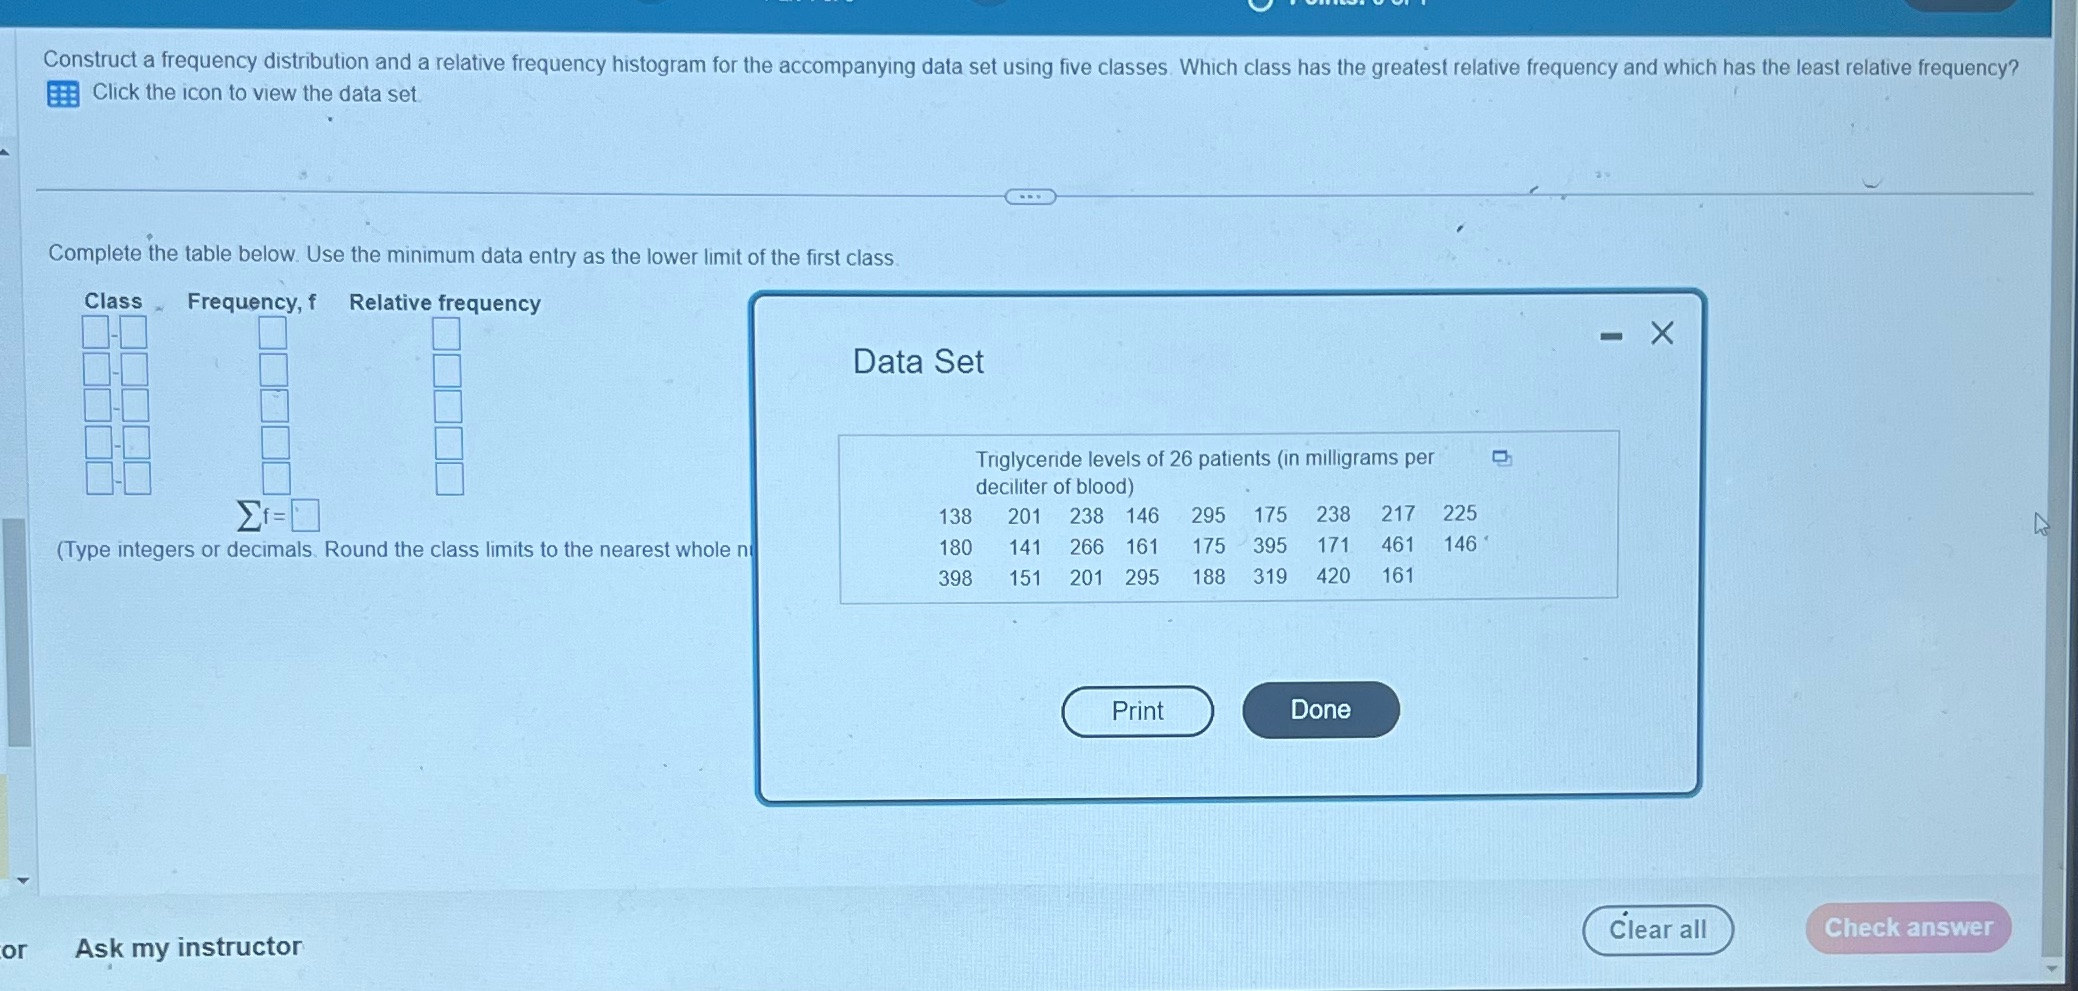
Question: Construct a frequency distribution and a relative frequency histogram for the accompanying data set using five classes. Which class has the greatest relative frequency and

Construct a frequency distribution and a relative
Construct a frequency distribution and a relative frequency histogram for the accompanying data set using five classes. Which class has the greatest relative frequency and which has the least relative frequency? Click the icon to view the data set. Complete the table below. Use the minimum data entry as the lower limit of the first class Class _ Frequency, f Relative frequency - X Data Set Triglyceride levels of 26 patients (in milligrams per deciliter of blood) Ef= 138 201 238 146 295 175 238 217 225 (Type integers or decimals. Round the class limits to the nearest whole n 180 141 266 161 175 395 171 461 146 398 151 201 295 188 319 420 161 Print Done or Ask my instructor Clear all Check

Step by Step Solution

There are 3 Steps involved in it

1 Expert Approved Answer
Step: 1 Unlock blur-text-image
Question Has Been Solved by an Expert!

Get step-by-step solutions from verified subject matter experts

Step: 2 Unlock
Step: 3 Unlock

Students Have Also Explored These Related Mathematics Questions!