

Question: Construct a normal probability plot for the following sample of observations on coating thickness for low-viscosity paint. 0.82 0.89 0.90 1.02 1.10 1.11 1.30 1.31
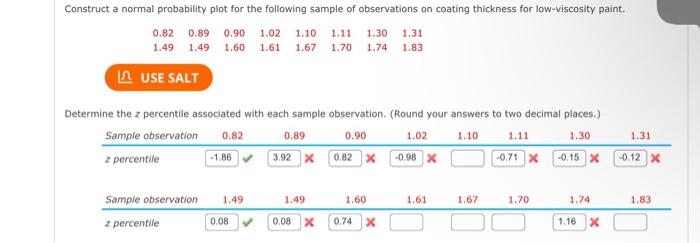
Construct a normal probability plot for the following sample of observations on coating thickness for low-viscosity paint. 0.82 0.89 0.90 1.02 1.10 1.11 1.30 1.31 1.49 1.49 1.60 1.61 1.67 1.70 1.74 1.83 USE SALT Determine the z percentile associated with each sample observation, (Round your answers to two decimal places.) Sample observation 0.82 0.89 0.90 1.02 1.10 1.30 -1.86 3.92 X -0.98 X 2 percentile -0.71 x -0.15 X 1.31 0.82 X -0.12 X 1.49 1.49 1.60 1.61 1.67 1.70 1.74 1.83 Sample observation z percentile 0.08 0.08 0.74 X 1.16 X
Step by Step Solution
There are 3 Steps involved in it
1 Expert Approved Answer
Step: 1 Unlock

Question Has Been Solved by an Expert!
Get step-by-step solutions from verified subject matter experts
Step: 2 Unlock
Step: 3 Unlock