

Question: Construct a normal probability plot for the following sample of observations on coating thickness for low-viscosity paint. 0.84 0.86 0.89 1.03 1.11 1.14 1.31 1.32
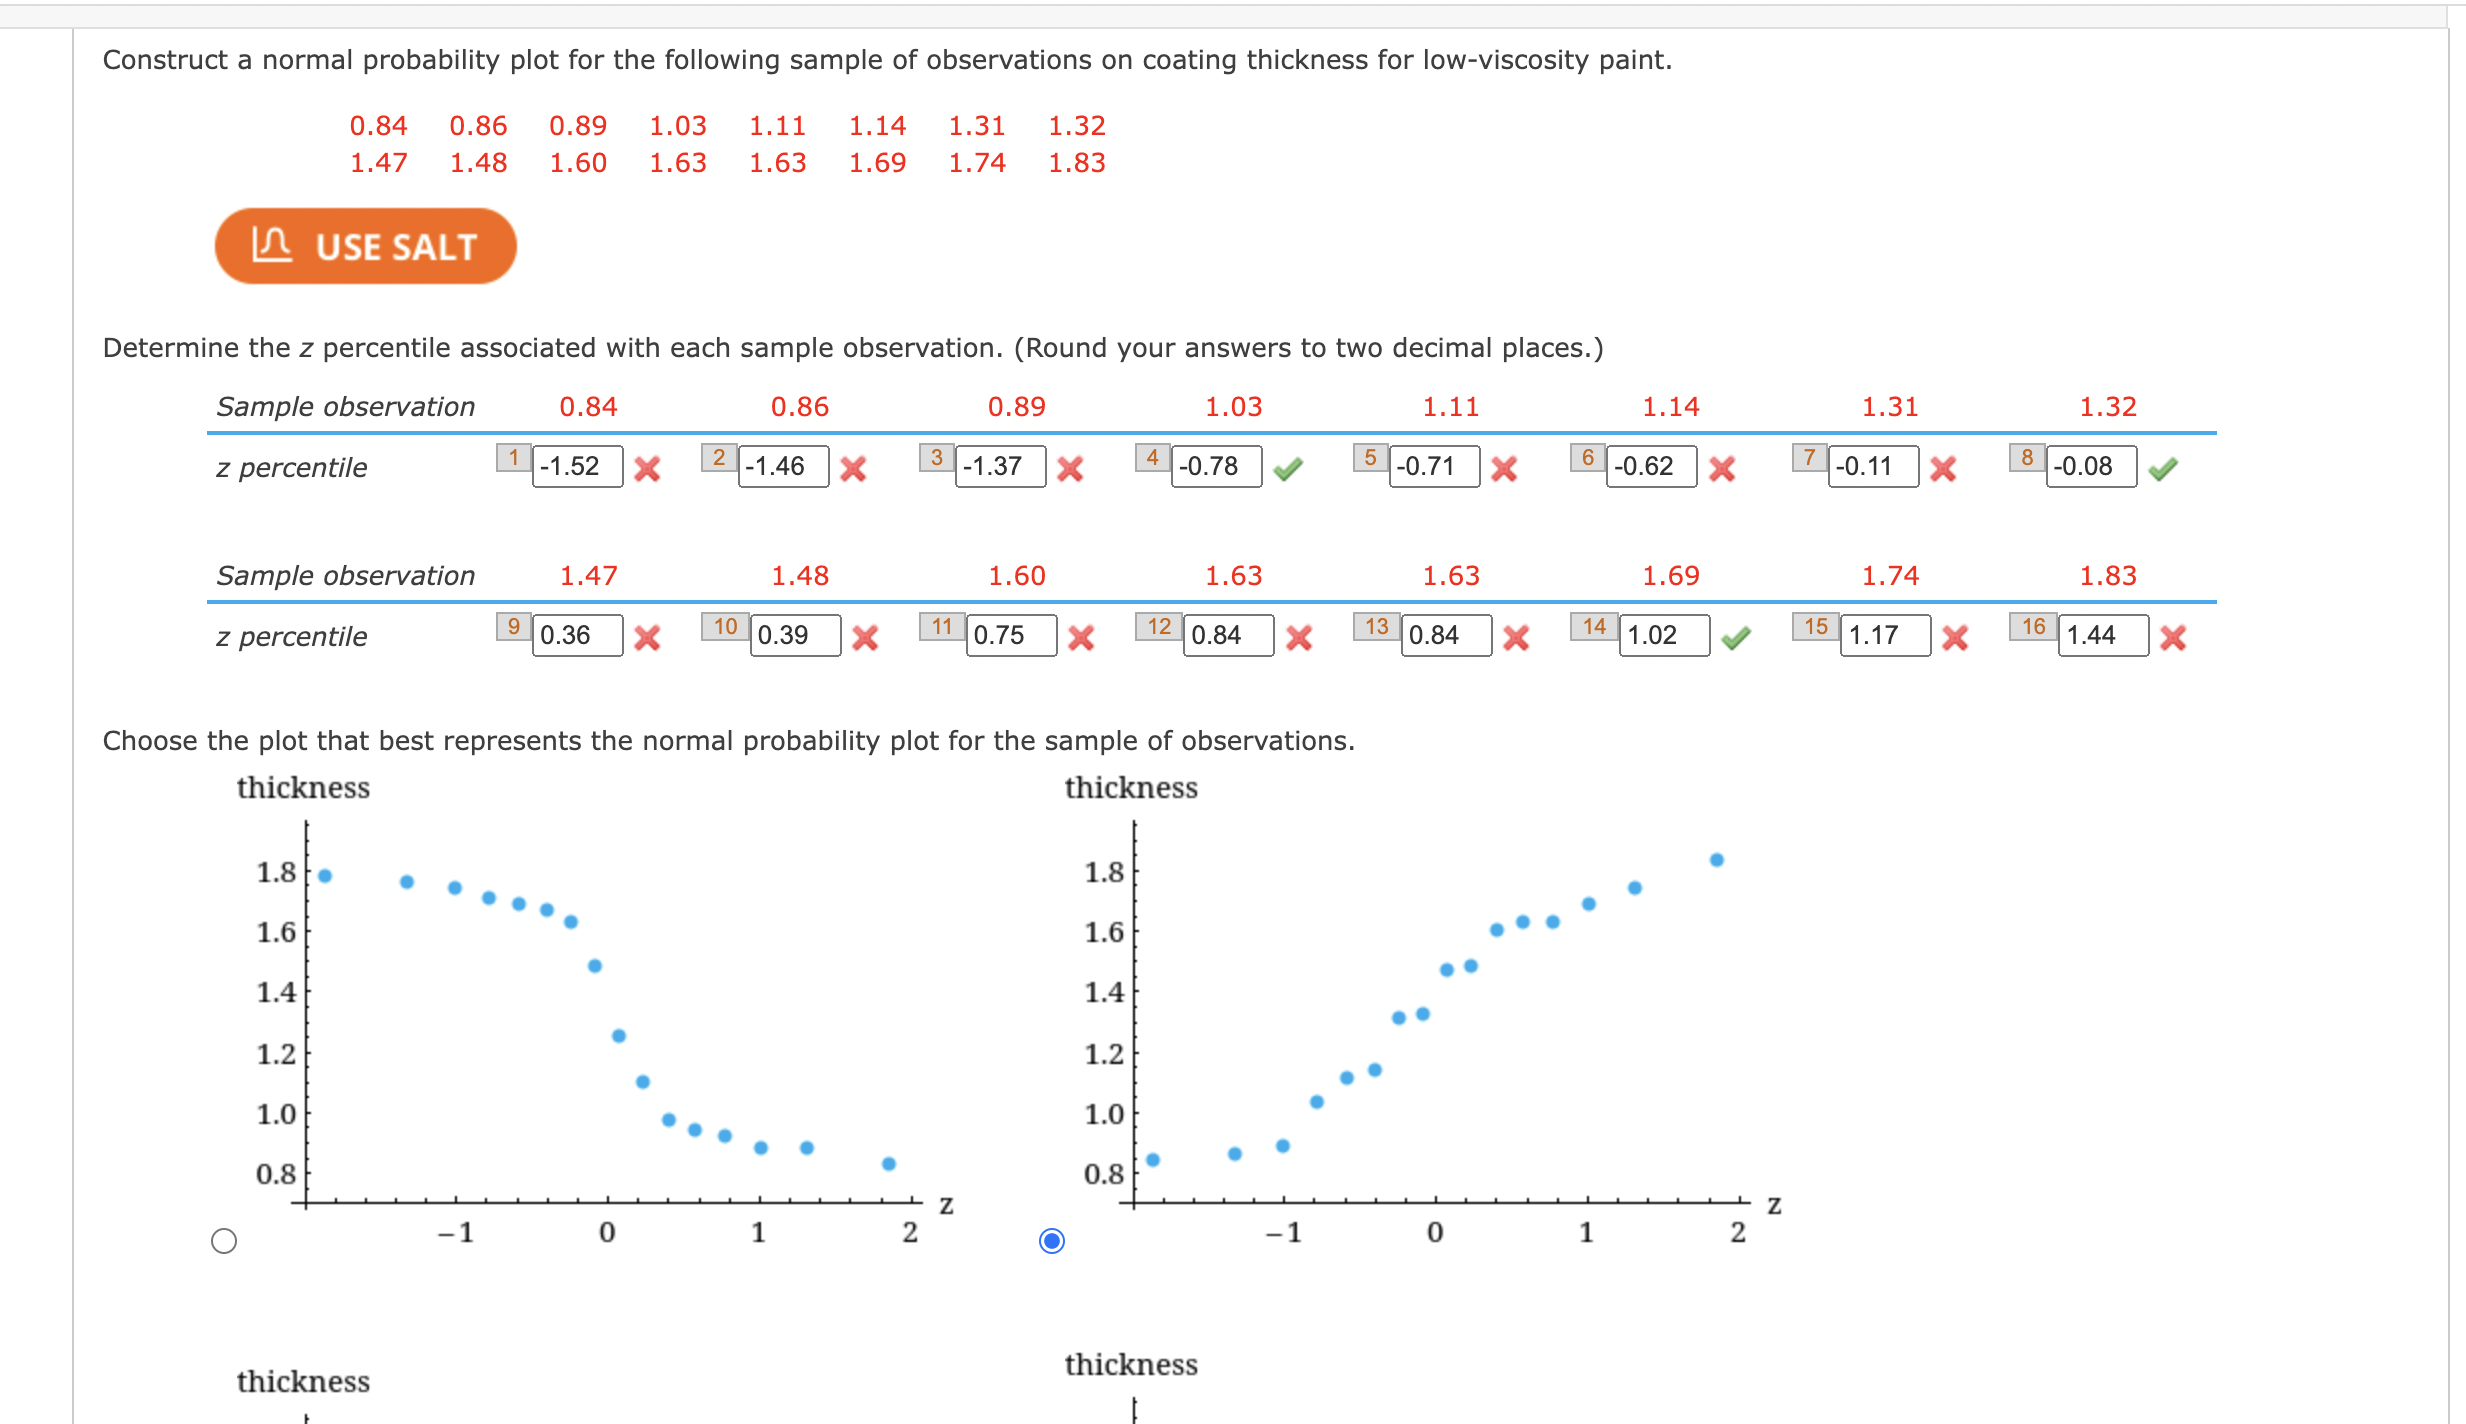

Construct a normal probability plot for the following sample of observations on coating thickness for low-viscosity paint. 0.84 0.86 0.89 1.03 1.11 1.14 1.31 1.32 1.47 1.48 1.60 1.63 1.63 1.69 1.74 1.83 LO USE SALT Determine the z percentile associated with each sample observation. (Round your answers to two decimal places.) Sample observation 0.84 0.86 0.89 1.03 1.11 1.14 1.31 1.32 z percentile 1 -1.52 X 2 -1.46 X 3 -1.37 X 4 -0.78 V 5 -0.71 X 6 -0.62 X 7 -0.11 X 8 -0.08 Sample observation 1.47 1.48 1.60 1.63 1.63 1.69 1.74 1.83 z percentile 9 0 .36 X 10 0.39 X 11 0.75 X 0.84 X 13 0.84 X 14 1.02 15 1.17 X 16 1.44 X Choose the plot that best represents the normal probability plot for the sample of observations. thickness thickness 1.8. 1.8 . . . . . 1.6 1.6 . . . 1.4 1.4 . . 1.2 1.2 1.0 . . 1.0 0.8 0.8 Z O -1 0 1 O -1 0 1 2 thickness thickness
Step by Step Solution
There are 3 Steps involved in it

Get step-by-step solutions from verified subject matter experts