

Question: construct a number chat based on 50 samples of 2 from box of numbers to get mean then A,B,&C. please print legible Thank you! 152
construct a number chat based on 50 samples of 2 from box of numbers to get mean then A,B,&C. please print legible
Thank you!
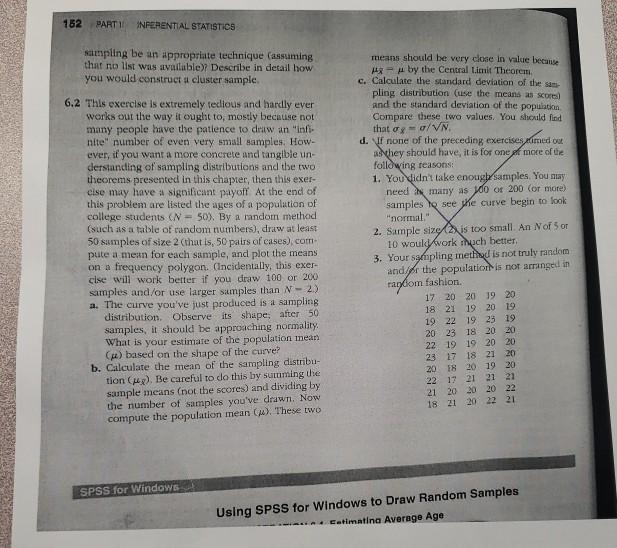
152 PARTI INFERENTIAL STATISTICS sampling be an appropriate technique (assuming that no list was available) Describe in detail how you would construct a cluster sample. 6.2 This exercise is extremely fecious and hardly ever works out the way it ought to, mostly because not many people have the patience to daw an inti nite number of even very small samples. How- ever, if you want a more concrete and tangible un derstanding of sampling distributions and the two theorems presented in this chapter, then this exer- cise may have a significant payoff At the end of this problem are listed the ages of a population of college students (N = 50). By a random method (such as a table of random numbers), draw at least 50 samples of size 2 (that is, 50 pairs of cases), com pute a mean for each sample, and plot the means on a frequency polygon. Incidentally, this exer- cise will work better if you draw 100 or 200 samples and/or use larger samples than N - 2.) a. The curve you've just produced is a sampling distribution. Observe its shape; after 50 samples, it should be approaching normality What is your estimate of the population mean () based on the shape of the curve? b. Calculate the mean of the sampling distribu- tion (up). Be careful to do this by sutuming the sample means (not the scores) and dividing by the number of samples you've drawn. Now compute the population mean (). These two means should be very close in value because uz by the Central Limit Theorem. c. Calculate the standard deviation of the sun pling distribution (use the means as scores and the standard deviation of the population Compare these two values. You should find that o=0/VN. d. If none of the preceding exercises aimerio they should have, it is for one or more of the following reasons: 1. You didn't take enoug/samples. You may need in many as yo or 200 (or more) samples to see the curve begin to look "normal" 2. Sample size is too small An Nof 5 or 10 would work rhuch better 3. Your sampling method is not truly random and fr the population is not arranged in random fashion 17 20 2019 20 18 21 19 20 19 1922 1923 19 20 23 18 20 20 22 19 19 20 20 23 17 18 21 20 20 18 2019 20 22 17 21 21 21 21 20 20 20 22 18 21 20 22 21 SPSS for Windows Using SPSS for Windows to Draw Random Samples Catimating Average Age 152 PARTI INFERENTIAL STATISTICS sampling be an appropriate technique (assuming that no list was available) Describe in detail how you would construct a cluster sample. 6.2 This exercise is extremely fecious and hardly ever works out the way it ought to, mostly because not many people have the patience to daw an inti nite number of even very small samples. How- ever, if you want a more concrete and tangible un derstanding of sampling distributions and the two theorems presented in this chapter, then this exer- cise may have a significant payoff At the end of this problem are listed the ages of a population of college students (N = 50). By a random method (such as a table of random numbers), draw at least 50 samples of size 2 (that is, 50 pairs of cases), com pute a mean for each sample, and plot the means on a frequency polygon. Incidentally, this exer- cise will work better if you draw 100 or 200 samples and/or use larger samples than N - 2.) a. The curve you've just produced is a sampling distribution. Observe its shape; after 50 samples, it should be approaching normality What is your estimate of the population mean () based on the shape of the curve? b. Calculate the mean of the sampling distribu- tion (up). Be careful to do this by sutuming the sample means (not the scores) and dividing by the number of samples you've drawn. Now compute the population mean (). These two means should be very close in value because uz by the Central Limit Theorem. c. Calculate the standard deviation of the sun pling distribution (use the means as scores and the standard deviation of the population Compare these two values. You should find that o=0/VN. d. If none of the preceding exercises aimerio they should have, it is for one or more of the following reasons: 1. You didn't take enoug/samples. You may need in many as yo or 200 (or more) samples to see the curve begin to look "normal" 2. Sample size is too small An Nof 5 or 10 would work rhuch better 3. Your sampling method is not truly random and fr the population is not arranged in random fashion 17 20 2019 20 18 21 19 20 19 1922 1923 19 20 23 18 20 20 22 19 19 20 20 23 17 18 21 20 20 18 2019 20 22 17 21 21 21 21 20 20 20 22 18 21 20 22 21 SPSS for Windows Using SPSS for Windows to Draw Random Samples Catimating Average AgeStep by Step Solution
There are 3 Steps involved in it
1 Expert Approved Answer
Step: 1 Unlock

Question Has Been Solved by an Expert!
Get step-by-step solutions from verified subject matter experts
Step: 2 Unlock
Step: 3 Unlock