

Question: Construct a plot of ln( K sp ) vs 1 T using your data from the above table. From the graph determine the slope and
Construct a plot of ln(Ksp) vs 1T using your data from the above table. From the graph determine the slope and evaluate H. For the R-value, use 8.314 Jmol1K1.
(i) slope = H/R
(ii) H Jmol1
(b) From your plot of ln(Ksp) vs 1T, find the y-intercept to determine S.
(i)SR = ln(Ksp) + HRT
(ii) S (Use the data you entered for 25 mL to solve for S.)
Jmol1K1
c) Using your experimentally determined H and S, determine the G at 60.0C.
Jmol1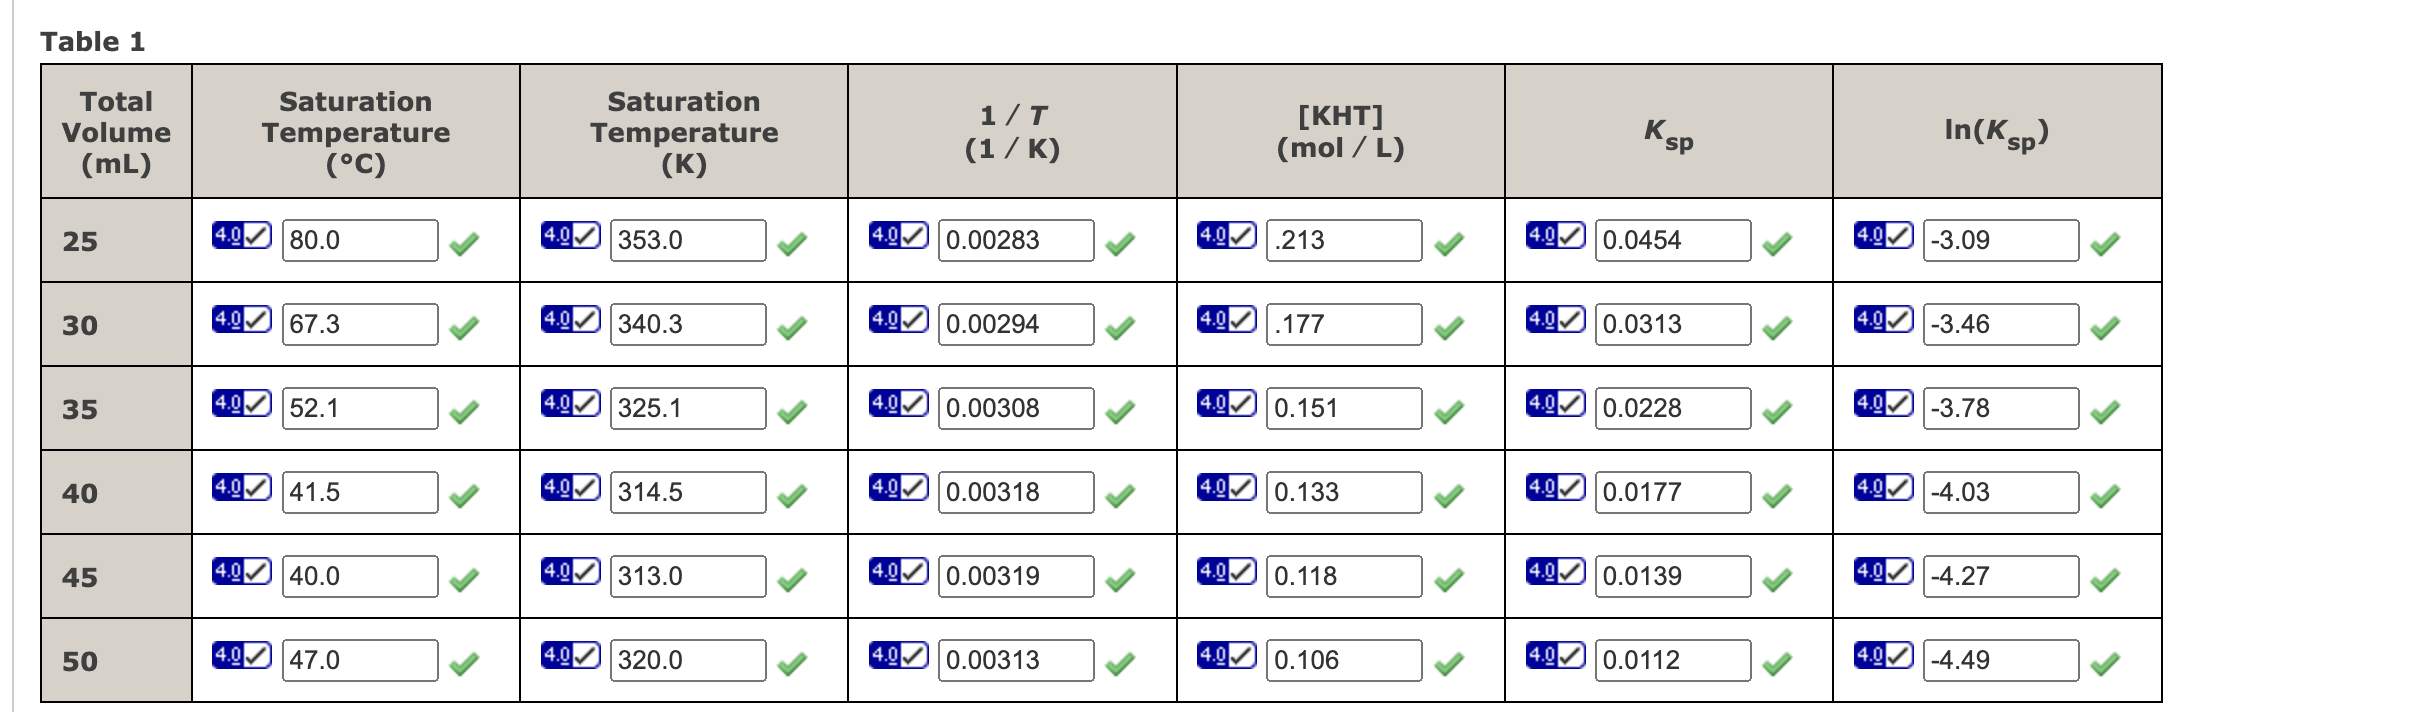
Table 1
Step by Step Solution
There are 3 Steps involved in it
1 Expert Approved Answer
Step: 1 Unlock

Question Has Been Solved by an Expert!
Get step-by-step solutions from verified subject matter experts
Step: 2 Unlock
Step: 3 Unlock