

Question: Construct a stem-leaf plot for the data values listed below. The leaves on each row should be soned In numerical order. Data Stem-Leaf Plot Boxplot
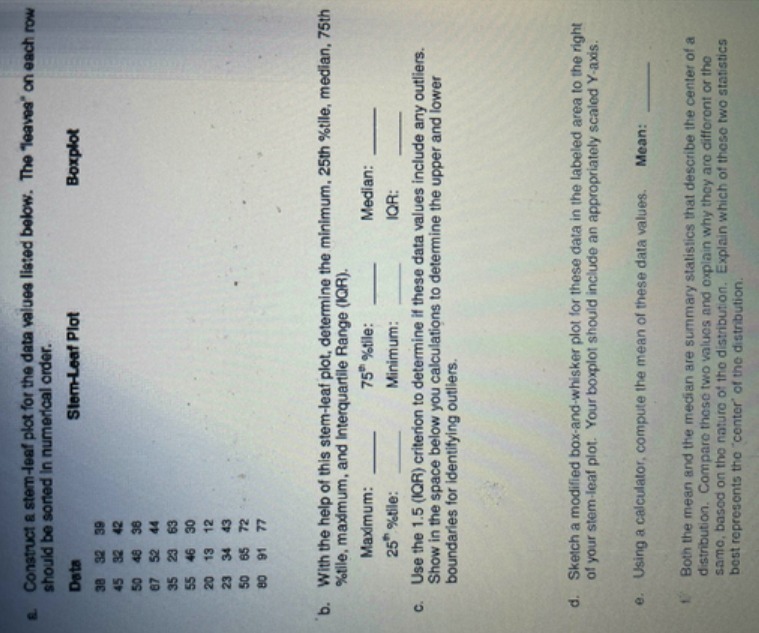
Construct a stem-leaf plot for the data values listed below. The "leaves" on each row should be soned In numerical order. Data Stem-Leaf Plot Boxplot b. With the help of this stem-leaf plot, determine the minimum, 25th %tile, median, 75th %tile, maximum, and Interquartile Range (IQR). Maximum: 75 %tile: Median: 25 %tile: Minimum: IQR: C. Use the 1.5 (IQR) criterion to determine if these data values include any outliers. Show in the space below you calculations to determine the upper and lower boundaries for identifying outliers. . Sketch a modified box-and-whisker plot for these data in the labeled area to the right of your stem-leaf plot. Your boxplot should include an appropriately scaled Y-axis. e. Using a calculator, compute the mean of these data values. Mean: Both the mean and the median are summary statistics that describe the center of a distribution. Compare these two values and explain why they are different or the same, based on the nature of the distribution. Explain which of these two statistics best represents the "center" of the distribution
Step by Step Solution
There are 3 Steps involved in it

Get step-by-step solutions from verified subject matter experts