

Question: Construct a T^2 chart using the data on X_1 = legal appearances overtime hours. X_2 = extraordinary event overtime hours, and X_3 = holdover hours
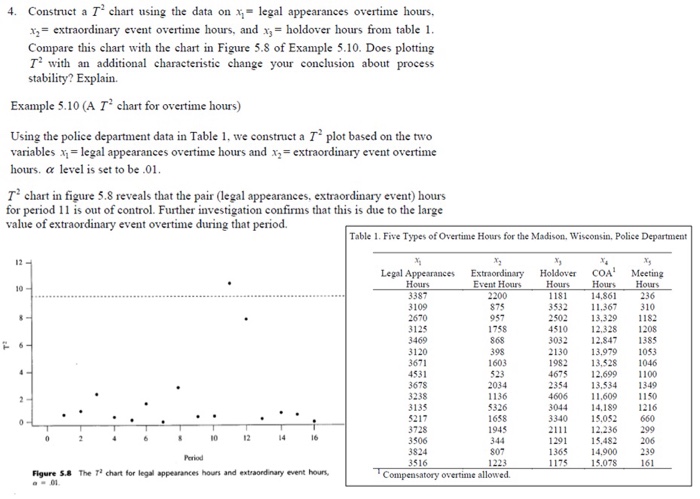
Construct a T^2 chart using the data on X_1 = legal appearances overtime hours. X_2 = extraordinary event overtime hours, and X_3 = holdover hours from table 1 Compare this chart with the chart in Figure 5.8 of Example 5.10. Does plotting T^2 with an additional characteristic change your conclusion about process stability? Explain. Using the police department data in Table 1. we construct a T^2 plot based on the two variables x_1 = legal appearances overtime hours and x_2 = extraordinary event overtime hours. alpha level is set to be .01. T^2 chart in figure 5 s reveals that the pair (legal appearances, extraordinary event) hours for period 11 is out of control. Further investigation confirms that this is due to the large value of extraordinary event overtime during that period. Construct a T^2 chart using the data on X_1 = legal appearances overtime hours. X_2 = extraordinary event overtime hours, and X_3 = holdover hours from table 1 Compare this chart with the chart in Figure 5.8 of Example 5.10. Does plotting T^2 with an additional characteristic change your conclusion about process stability? Explain. Using the police department data in Table 1. we construct a T^2 plot based on the two variables x_1 = legal appearances overtime hours and x_2 = extraordinary event overtime hours. alpha level is set to be .01. T^2 chart in figure 5 s reveals that the pair (legal appearances, extraordinary event) hours for period 11 is out of control. Further investigation confirms that this is due to the large value of extraordinary event overtime during that period
Step by Step Solution
There are 3 Steps involved in it

Get step-by-step solutions from verified subject matter experts