

Question: Construct an appropriate control chart, compute the upper and lower control limits, plot the data on a control chart, and determine if the process is
Construct an appropriate control chart, compute the upper and lower control limits, plot the data on a control chart, and determine if the process is in statistical control. Based on your analysis, what action, if any, should management take?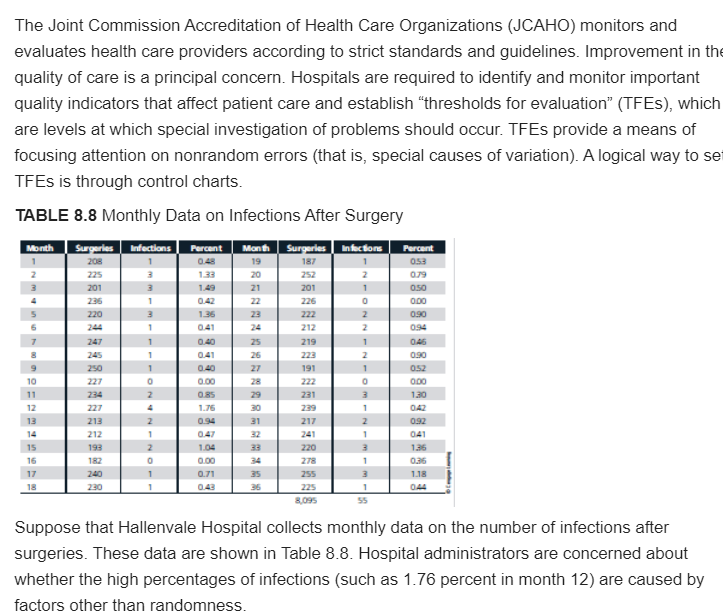
The Joint Commission Accreditation of Health Care Organizations (JCAHO) monitors and evaluates health care providers according to strict standards and guidelines. Improvement in the quality of care is a principal concern. Hospitals are required to identify and monitor important quality indicators that affect patient care and establish "thresholds for evaluation (TFES), which are levels at which special investigation of problems should occur. TFEs provide a means of focusing attention on nonrandom errors (that is, special causes of variation). A logical way to se TFES is through control charts. TABLE 8.8 Monthly Data on Infections After Surgery Month 1 Infections Percent Infections 1 2 1.33 Surgeries 208 225 201 235 220 244 Surgeries 187 252 201 225 Month 19 20 21 22 22 24 3 1 1 Percent 053 0.79 0:50 000 0.90 094 5 1.36 222 212 3 1 1 1 7 247 245 2 2 1 2 1 25 26 27 8 1 227 0.90 052 000 130 9 10 11 12 13 0 0.41 0.40 0.00 0.85 1.75 0.94 2 4 30 31 32 3 1 2 1 2 1 2 219 223 191 222 231 239 217 241 220 278 255 225 8.095 227 213 212 193 182 240 230 15 16 17 1.04 0.92 041 136 02 1.18 1 1 0.71 0.43 35 36 1 1 55 Suppose that Hallenvale Hospital collects monthly data on the number of infections after surgeries. These data are shown in Table 8.8. Hospital administrators are concerned about whether the high percentages of infections (such as 1.76 percent in month 12) are caused by factors other than randomness. The Joint Commission Accreditation of Health Care Organizations (JCAHO) monitors and evaluates health care providers according to strict standards and guidelines. Improvement in the quality of care is a principal concern. Hospitals are required to identify and monitor important quality indicators that affect patient care and establish "thresholds for evaluation (TFES), which are levels at which special investigation of problems should occur. TFEs provide a means of focusing attention on nonrandom errors (that is, special causes of variation). A logical way to se TFES is through control charts. TABLE 8.8 Monthly Data on Infections After Surgery Month 1 Infections Percent Infections 1 2 1.33 Surgeries 208 225 201 235 220 244 Surgeries 187 252 201 225 Month 19 20 21 22 22 24 3 1 1 Percent 053 0.79 0:50 000 0.90 094 5 1.36 222 212 3 1 1 1 7 247 245 2 2 1 2 1 25 26 27 8 1 227 0.90 052 000 130 9 10 11 12 13 0 0.41 0.40 0.00 0.85 1.75 0.94 2 4 30 31 32 3 1 2 1 2 1 2 219 223 191 222 231 239 217 241 220 278 255 225 8.095 227 213 212 193 182 240 230 15 16 17 1.04 0.92 041 136 02 1.18 1 1 0.71 0.43 35 36 1 1 55 Suppose that Hallenvale Hospital collects monthly data on the number of infections after surgeries. These data are shown in Table 8.8. Hospital administrators are concerned about whether the high percentages of infections (such as 1.76 percent in month 12) are caused by factors other than randomness
Step by Step Solution
There are 3 Steps involved in it

Get step-by-step solutions from verified subject matter experts