

Question: Construct an experimental, discrete probability table by rolling three six-sided dice and calculating the total. Perform 200 trials and record the results. The rolling of
Construct an experimental, discrete probability table by rolling three six-sided dice and calculating the total. Perform 200 trials and record the results. The rolling of three six-sided dice can be simulated using a graphing calculator by "rolling" each of the dice in a separate list using:
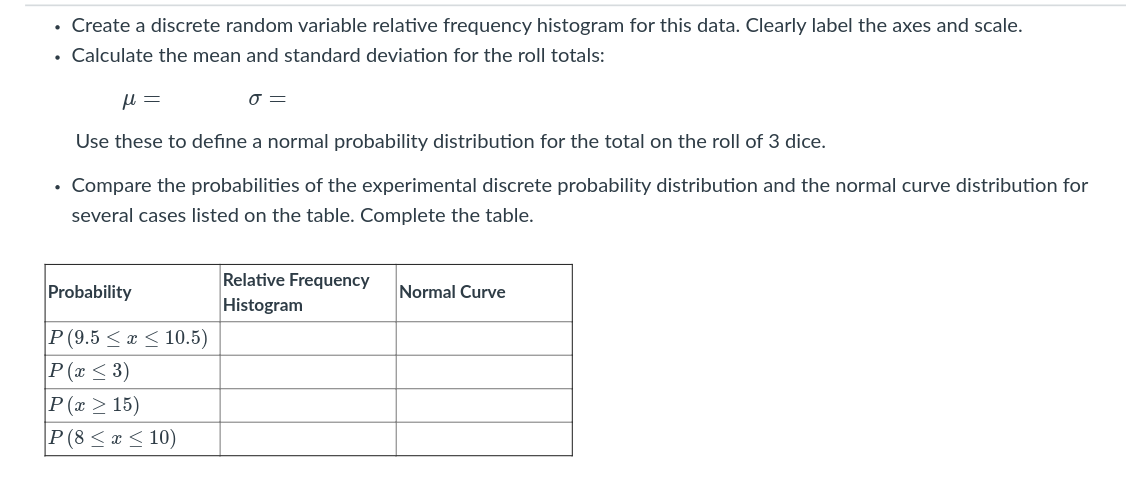
. Create a discrete random variable relative frequency histogram for this data. Clearly label the axes and scale. . Calculate the mean and standard deviation for the roll totals: U = O = Use these to define a normal probability distribution for the total on the roll of 3 dice. . Compare the probabilities of the experimental discrete probability distribution and the normal curve distribution for several cases listed on the table. Complete the table. Probability Relative Frequency Normal Curve Histogram P (9.5 15) P (8 15) P (8
Step by Step Solution
There are 3 Steps involved in it

Get step-by-step solutions from verified subject matter experts