

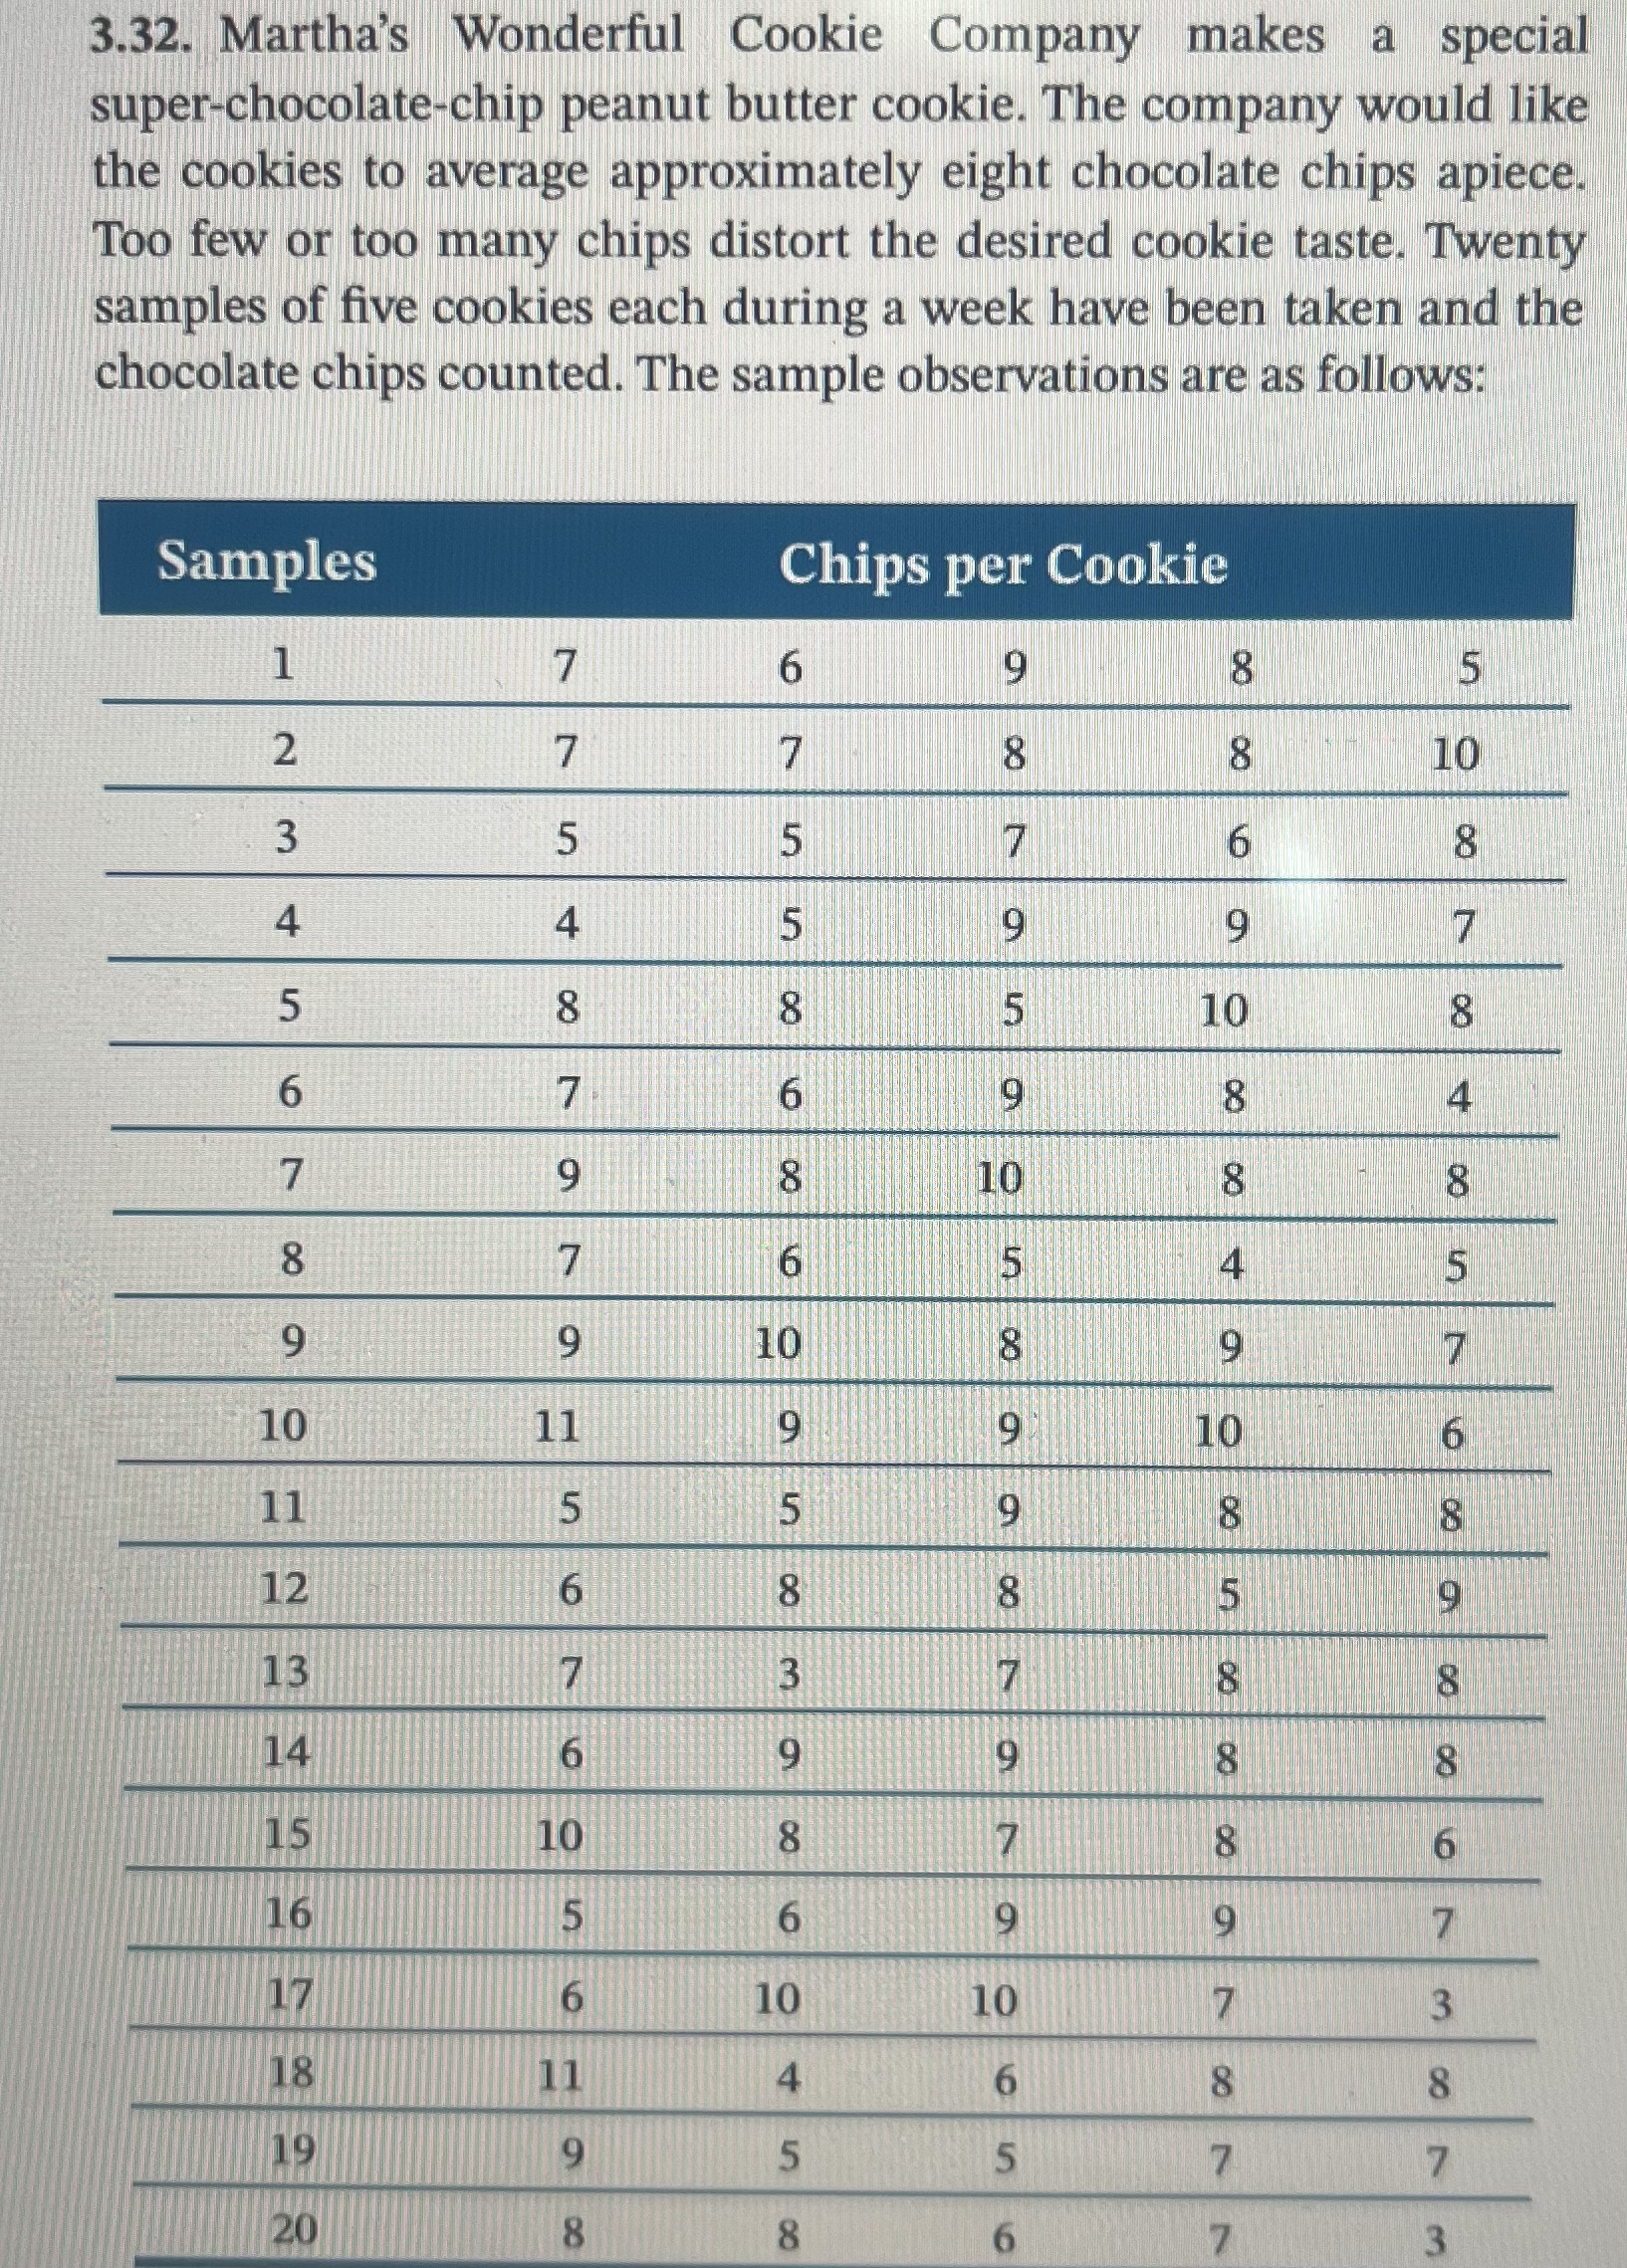
Question: Construct an x - bar - chart in conjunction with an R - chart using 3 - sigma limits for these data and use these
Construct an xbarchart in conjunction with an Rchart using sigma limits for these data and use these charts to comment on the cookieproduction process.You do not need to show the charts. Just explain what you can tell from the charts. What would you tell the cookie company about the process?
DATA IS IN PHOTO
Step by Step Solution
There are 3 Steps involved in it
1 Expert Approved Answer
Step: 1 Unlock

Question Has Been Solved by an Expert!
Get step-by-step solutions from verified subject matter experts
Step: 2 Unlock
Step: 3 Unlock