

Question: Construct an X chart R chart for the following data set. (Leave no cells blank - be certain to enter 0 wherever required. Do not
Construct an X chartR chart for the following data set. (Leave no cells blank - be certain to enter "0" wherever required. Do not round intermediate calculations. Round your answers to 2 decimal places.)
| Sub group No | 6:00 | 10:00 | 14:00 | 18:00 | 22:00 | x bar | R |
| 1 | 14.0 | 14.0 | 13.0 | 14.6 | 12.0 | 13.5 | 2.6 |
| 2 | 12.4 | 13.7 | 14.4 | 14.7 | 12.9 | 13.6 | 2.3 |
| 3 | 13.4 | 15.0 | 14.6 | 14.8 | 13.6 | 14.3 | 1.6 |
| 4 | 12.4 | 13.9 | 13.5 | 14.3 | 14.8 | 13.8 | 2.4 |
| 5 | 12.6 | 12.1 | 13.5 | 12.6 | 14.2 | 12.8 | 2.1 |
| 6 | 13.9 | 13.8 | 14.9 | 13.1 | 15.0 | 14.1 | 1.9 |
| 7 | 14.4 | 14.1 | 14.8 | 13.7 | 13.3 | 14.1 | 1.5 |
| 8 | 14.4 | 12.7 | 14.0 | 12.3 | 12.0 | 13.1 | 2.4 |
| 9 | 14.5 | 12.4 | 12.2 | 13.6 | 13.3 | 13.2 | 2.3 |
| 10 | 14.3 | 13.1 | 12.5 | 14.4 | 12.7 | 13.4 | 1.9 |
| 11 | 14.8 | 14.9 | 12.2 | 13.6 | 13.8 | 13.9 | 2.7 |
| 12 | 15.0 | 12.0 | 12.4 | 14.6 | 13.0 | 13.4 | 3.0 |
| 13 | 13.7 | 13.6 | 14.1 | 13.2 | 13.0 | 13.5 | 1.1 |
| 14 | 14.8 | 14.3 | 13.6 | 13.9 | 14.7 | 14.3 | 1.2 |
| 15 | 13.5 | 12.5 | 12.9 | 14.3 | 14.3 | 13.5 | 1.8 |
| 16 | 12.7 | 13.5 | 13.4 | 12.8 | 12.2 | 12.9 | 1.3 |
| 17 | 15.0 | 14.4 | 12.2 | 14.5 | 13.7 | 14.0 | 2.8 |
| 18 | 14.4 | 13.6 | 12.1 | 14.4 | 13.9 | 13.7 | 2.3 |
| 19 | 12.1 | 13.1 | 14.4 | 13.3 | 13.1 | 13.2 | 2.3 |
| 20 | 15.0 | 13.4 | 14.1 | 14.1 | 14.5 | 14.2 | 1.6 |
| 21 | 14.8 | 13.0 | 12.3 | 14.6 | 13.4 | 13.6 | 2.5 |
| 22 | 13.3 | 12.3 | 12.9 | 14.3 | 12.6 | 13.1 | 2.0 |
| 23 | 14.9 | 14.6 | 12.5 | 14.3 | 12.1 | 13.7 | 2.8 |
| 24 | 14.3 | 12.7 | 12.7 | 13.0 | 13.3 | 13.2 | 1.6 |
| 25 | 12.9 | 13.6 | 12.9 | 14.4 | 12.6 | 13.3 | 1.8 |
| Sum | 339.22 | 51.80 | |||||
| Grand Mean | 13.57 | 2.07 | |||||
|
| |||||||
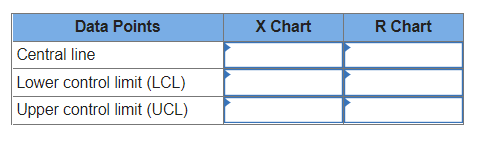
Data Points Central line Lower control limit (LCL) Upper control limit (UCL) X Chart R Chart
Step by Step Solution
There are 3 Steps involved in it
1 Expert Approved Answer
Step: 1 Unlock

Question Has Been Solved by an Expert!
Get step-by-step solutions from verified subject matter experts
Step: 2 Unlock
Step: 3 Unlock