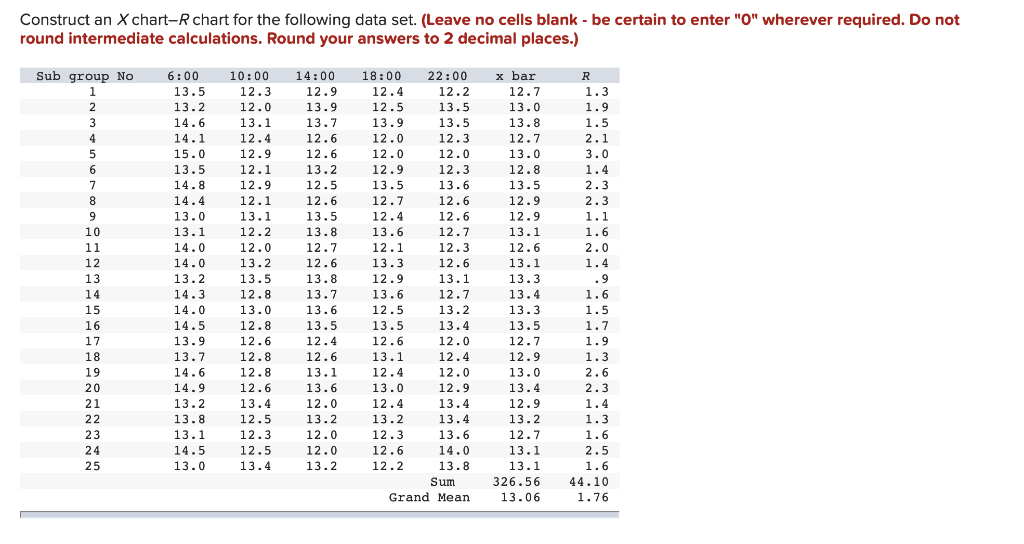
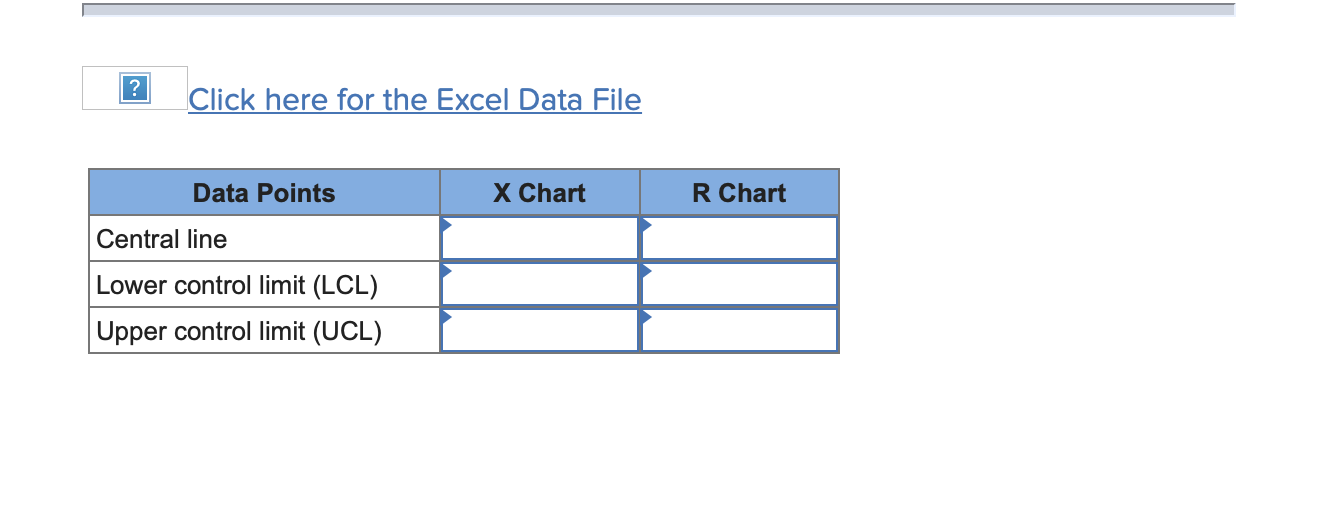
Question: Construct an X chart-R chart for the following data set. (Leave no cells blank - be certain to enter O wherever required. Do not round

Construct an X chart-R chart for the followingConstruct an X chart-R chart for the following

Construct an X chart-R chart for the following data set. (Leave no cells blank - be certain to enter "O" wherever required. Do not round intermediate calculations. Round your answers to 2 decimal places.) Sub group No 1 2 3 x bar 12.7 13.0 13.8 12.7 13.0 128 12.8 13.5 4 12.7 12.9 5 6 7 7 g 8 9 9 10 11 12 13 14 19 15 16 17 18 19 20 21 22 23 24 25 6:00 13.5 13.2 14.6 14.1 15.0 13.5 14.8 14.4 13.0 13.1 13.1 14.0 14.0 13.2 14 14.3 14.0 11.0 14.5 12 13.9 13.7 14.6 14.0 14.9 13.2 13.8 13.1 14.5 13.0 10:00 12.3 12.0 13.1 12.4 12.9 12a 121 12.1 12.9 12.1 13.1 12.2. 12.2 12.0 13.2 13.5 12.8 140 13.0 12.0 12.8 14.0 12.6 12.8 140 12.8 12.6 13.4 12.5 12.3 12.5 13.4 14:00 12.9 13.9 13.7 12.6 1 12.6 13.2 12.5 12.6 13.5 13.8 12.7 12.6 13.8 13.7 13.6 13.5 12.4 *** 12.6 13.1 13.6 12.0 18:00 22:00 12.4 12.2 12.5 13.5 13.9 13.5 13 12.0 12.3 12.0 12 12 12.0 12 g 12.9 12.3 135 13.5 136 13.6 12.6 12.4 12.6 13.6 12.7 12.1 12.3 12.3 13.3 12.6 *** 12.9 13.1 13.6 12.7 12.5 13.2 13.5 12 13.4 23 12.6 12.0 40 13.1 12.4 . *** 12.4 12.0 13.0 ** 12.9 * 12.4 13.4 13.2 13.4 12 13.6 12.6 14.0 12.2 13.8 Sum Grand Mean 12.9 13.1 12.6 13.1 13.3 13.4 13.3 13.5 12.7 *** 12.9 14 13.0 13.4 12.9 13.2 12.7 13.1 13.1 326.56 13.06 R 1.3 1.9 1.5 2.1 3.0 1.4 2.3 2.3 2.3 1.1 1.6 2.0 2.0 1.4 .9 1.6 1.5 1.7 1.9 1.3 2.6 2.3 1.4 1.3 1.6 2.5 1.6 44.10 1.76 13.2 12.0 12.3 12.0 13.2 ? Click here for the Excel Data File Data Points X Chart R Chart Central line Lower control limit (LCL) Upper control limit (UCL)

Step by Step Solution

There are 3 Steps involved in it

1 Expert Approved Answer
Step: 1 Unlock blur-text-image
Question Has Been Solved by an Expert!

Get step-by-step solutions from verified subject matter experts

Step: 2 Unlock
Step: 3 Unlock

Students Have Also Explored These Related General Management Questions!