

Question: Construct line charts to identify the pattern of demand variability Construct a run chart to identify the pattern of variability in each of the six
Construct line charts to identify the pattern of demand variability
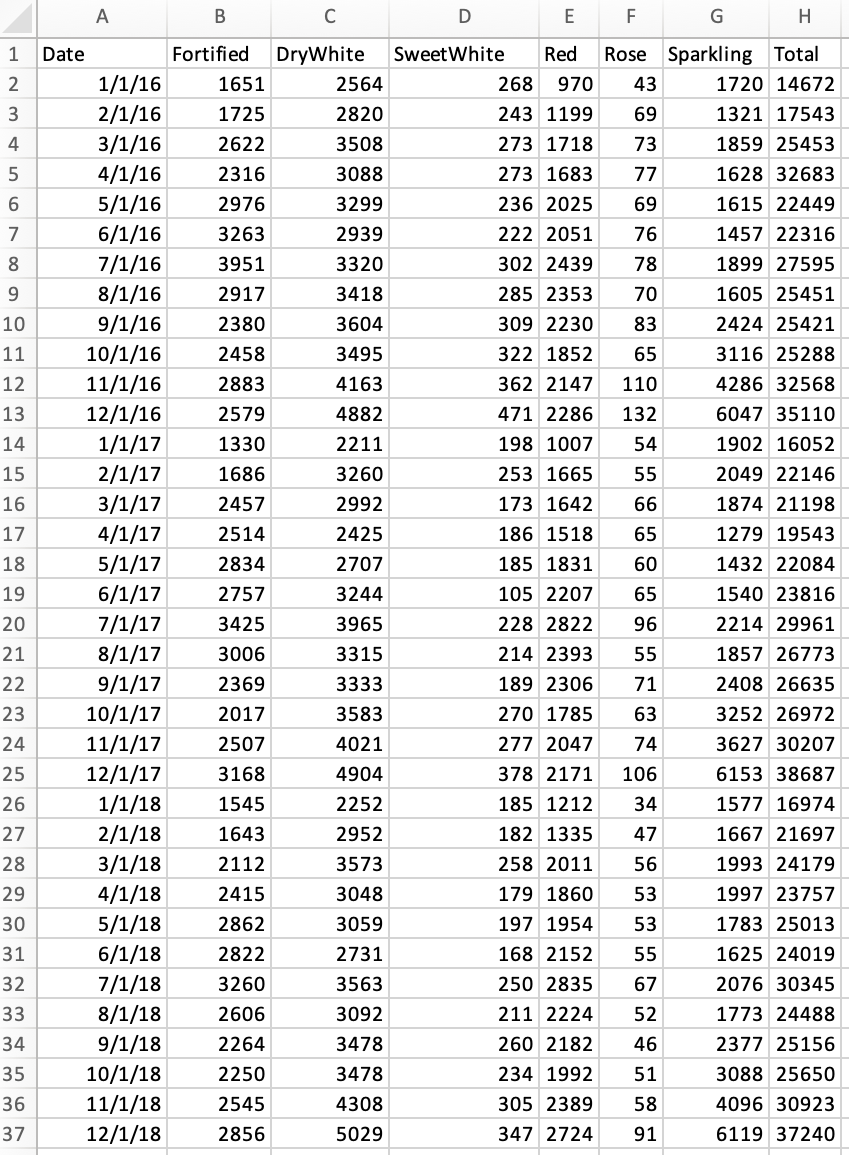
- Construct a run chart to identify the pattern of variability in each of the six major products demand (plot all six product demands in one run chart)
- Construct a run chart to identify the pattern of variability in the total number of bottles sold per month.
** Appropriate chart title, axis titles and axis labels must be presented in all charts **
** The horizontal axis in the charts should show month **
Please show me ho to create question 1, i need to do it on excel. And then answer question 2. Please show me images of all with chart title, axis titles and axis labels, horizontal axis with months. Thanks
1. Upload the run chart of the six major products demand below. (Appropriate chart title, axis titles and axis labels must be presented; the horizontal axis in the charts should show month)
2. Provide description of the pattern of variability that occur in each of the six major products demand (i.e. trend, seasonality, randomness etc.).
Step by Step Solution
There are 3 Steps involved in it

Get step-by-step solutions from verified subject matter experts