

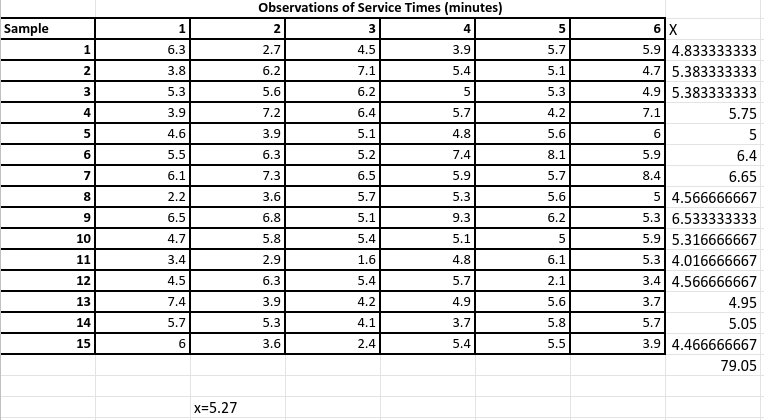
Question: Construct the appropriate quality control charts using the data provided in the case. Use X and R chart. Observations of Service Times (minutes) 2 Sample
Construct the appropriate quality control charts using the data provided in the case. Use X and R chart.
Step by Step Solution
There are 3 Steps involved in it
1 Expert Approved Answer
Step: 1 Unlock

Question Has Been Solved by an Expert!
Get step-by-step solutions from verified subject matter experts
Step: 2 Unlock
Step: 3 Unlock