

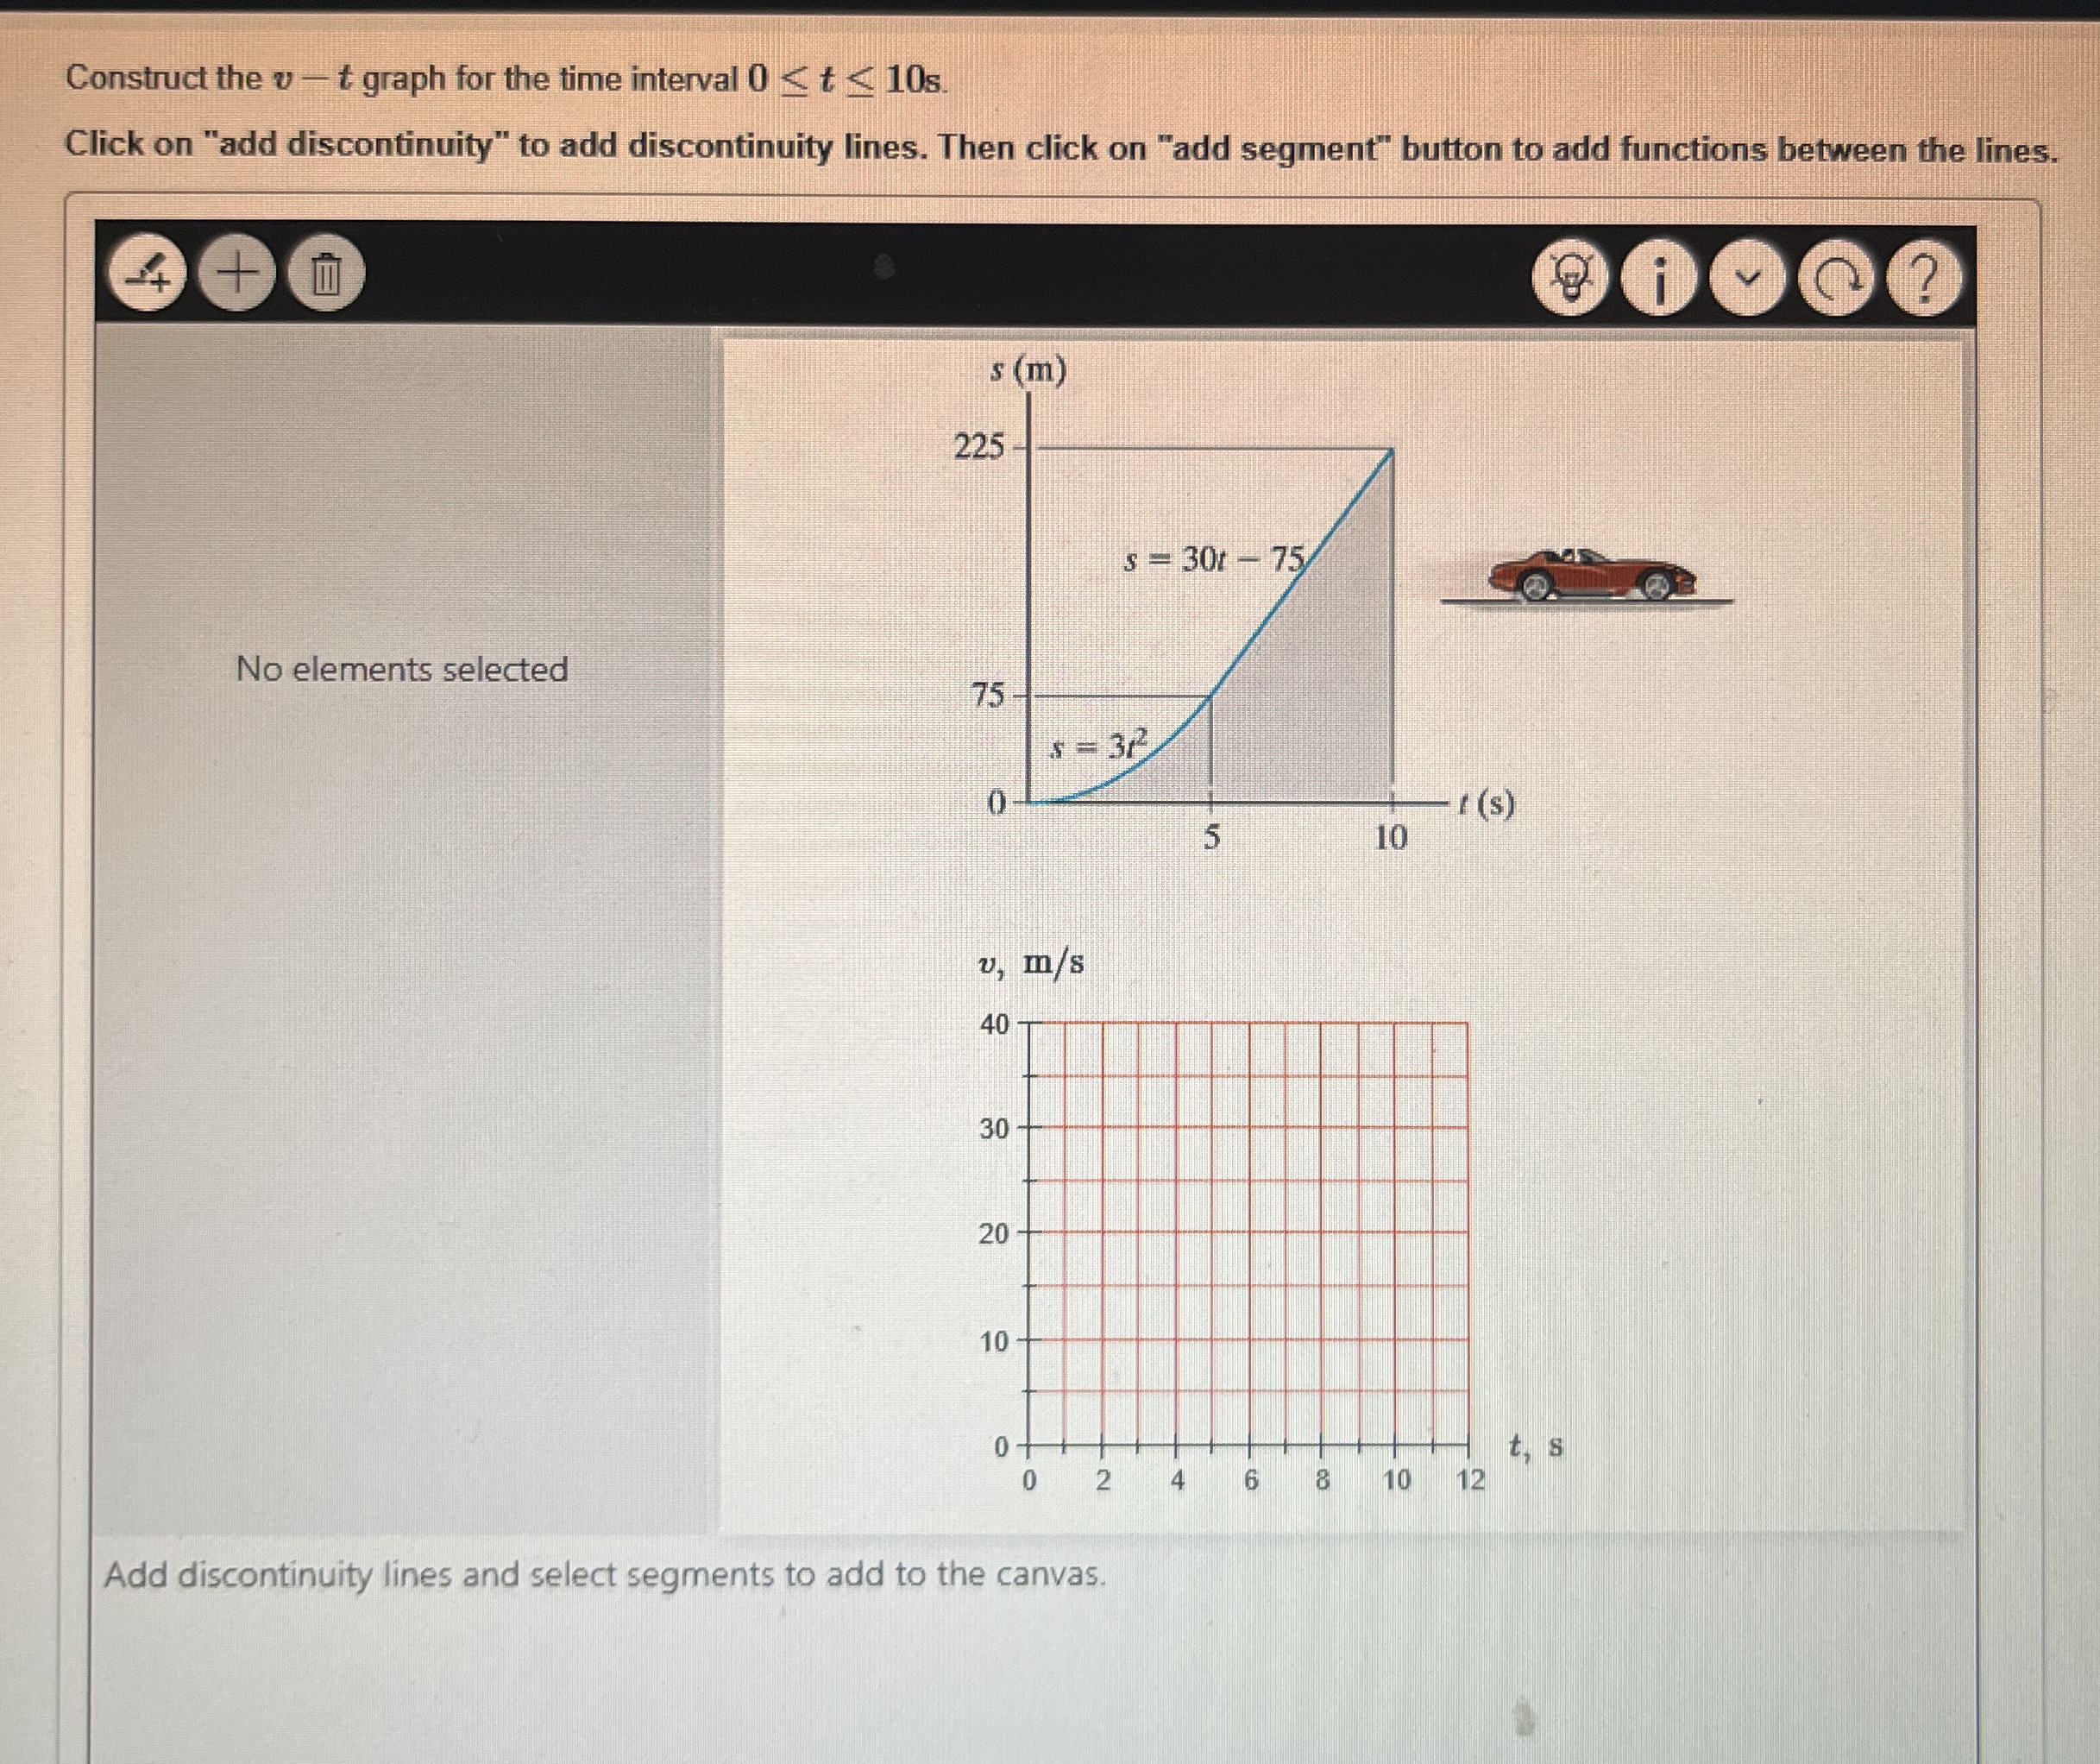
Question: Construct the v - t graph for the time interval 0 t 1 0 . Click on add discontinuity to add discontinuity lines. Then click
Construct the graph for the time interval
Click on "add discontinuity" to add discontinuity lines. Then click on "add segment" button to add functions between the lines.
No elements selected
Add discontinuity lines and select segments to add to the canvas.
Step by Step Solution
There are 3 Steps involved in it
1 Expert Approved Answer
Step: 1 Unlock

Question Has Been Solved by an Expert!
Get step-by-step solutions from verified subject matter experts
Step: 2 Unlock
Step: 3 Unlock