

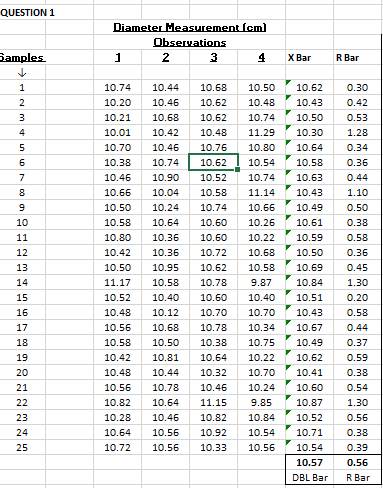
Question: Construct the X-bar and R charts for the data provided What is your interpretation of those two charts Please justify your answer. You learned that
- Construct the X-bar and R charts for the data provided
- What is your interpretation of those two charts Please justify your answer.
- You learned that the regular machine operator was absent when samples 4, 8, 14 and 22 were taken. Does it affect your interpretation of those charts? In what way(s) could an absent worker create a different pattern in the data
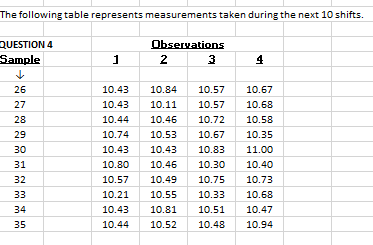
- The absent operator from question 3 is now back on the job. Ten more samples are collected during the next 10 shifts (samples 26 to 35). You plot this new data into two new control charts.
- What information does this new data provide to the quality control manager
- What steps would you take
Step by Step Solution
There are 3 Steps involved in it
1 Expert Approved Answer
Step: 1 Unlock

Question Has Been Solved by an Expert!
Get step-by-step solutions from verified subject matter experts
Step: 2 Unlock
Step: 3 Unlock