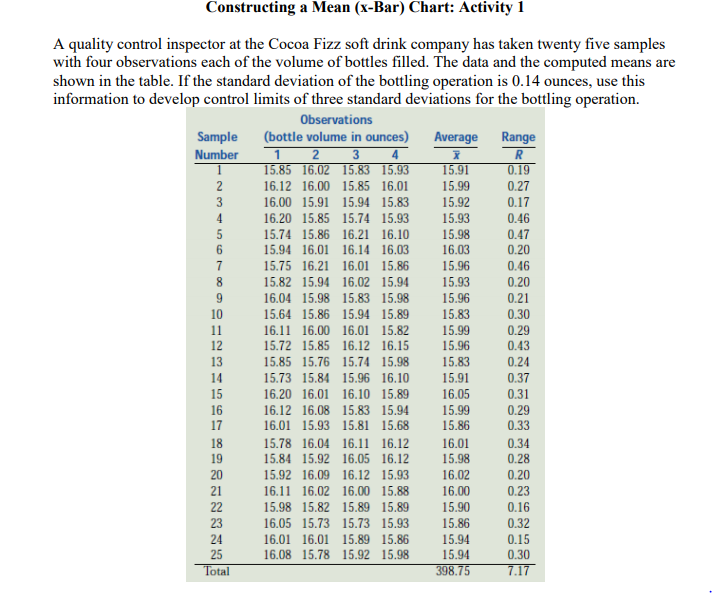
Question: Constructing a Mean (x-Bar) Chart: Activity 1 A quality control inspector at the Cocoa Fizz soft drink company has taken twenty five samples with four

Constructing a Mean (x-Bar) Chart: Activity 1 A

Constructing a Mean (x-Bar) Chart: Activity 1 A quality control inspector at the Cocoa Fizz soft drink company has taken twenty five samples with four observations each of the volume of bottles filled. The data and the computed means are shown in the table. If the standard deviation of the bottling operation is 0.14 ounces, use this information to develop control limits of three standard deviations for the bottling operation. Observations Sample (bottle volume in ounces) Average Range Number 1 2 3 x R 1 15.85 16.02 15.83 15.93 15.91 0.19 2 16.12 16.00 15.85 16.01 15.99 0.27 3 16.00 15.91 15.94 15.83 15.92 0.17 4 16.20 15.85 15.74 15.93 15.93 0.46 5 15.74 15.86 16.21 16.10 15.98 0.47 6 15.94 16.01 16.14 16.03 16.03 0.20 7 15.75 16.21 16.01 15.86 15.96 0.46 8 15.82 15.94 16.02 15.94 15.93 0.20 9 16.04 15.98 15.83 15.98 15.96 0.21 10 15.64 15.86 15.94 15.89 15.83 0.30 11 16.11 16.00 16.01 15.82 15.99 0.29 12 15.72 15.85 16.12 16.15 15.96 0.43 13 15.85 15.76 15.74 15.98 15.83 0.24 14 15.73 15.84 15.96 16.10 15.91 0.37 15 16.20 16.01 16.10 15.89 16.05 0.31 16 16.12 16.08 15.83 15.94 15.99 0.29 17 16.01 15.93 15.81 15.68 15.86 0.33 18 15.78 16.04 16.11 16.12 16.01 0.34 19 15.84 15.92 16.05 16.12 15.98 0.28 20 15.92 16.09 16.12 15.93 16.02 0.20 21 16.11 16.02 16.00 15.88 16.00 0.23 22 15.98 15.82 15.89 15.89 15.90 0.16 23 16.05 15.73 15.73 15.93 15.86 0.32 24 16.01 16.01 15.89 15.86 15.94 0.15 25 16.08 15.78 15.92 15.98 15.94 0.30 Total 398.75 7.17

Step by Step Solution

There are 3 Steps involved in it

1 Expert Approved Answer
Step: 1 Unlock blur-text-image
Question Has Been Solved by an Expert!

Get step-by-step solutions from verified subject matter experts

Step: 2 Unlock
Step: 3 Unlock

Students Have Also Explored These Related General Management Questions!