

Question: Constructing and Using Process Control Charts 1. Several samples of size n = 8 have been taken from today's production of fence posts. The average
Constructing and Using Process Control Charts
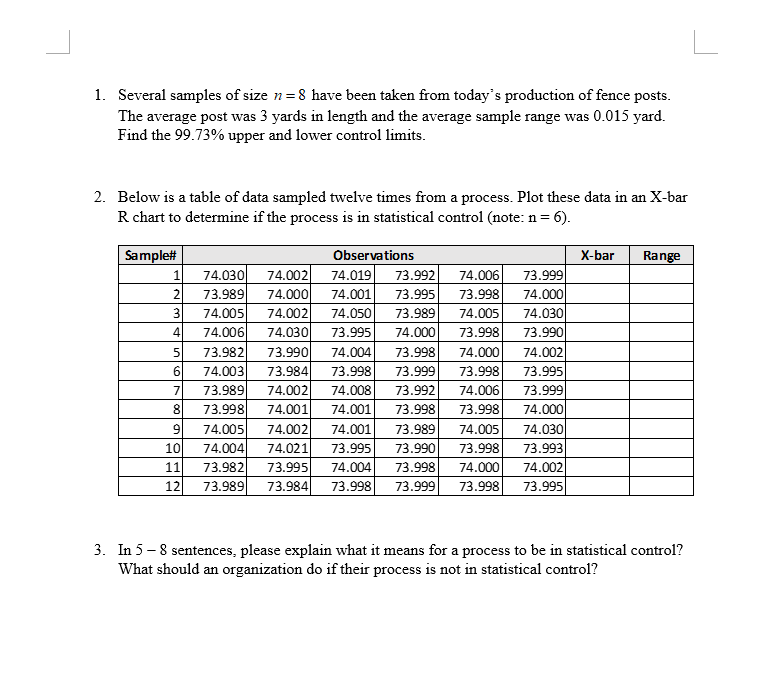
1. Several samples of size n = 8 have been taken from today's production of fence posts. The average post was 3 yards in length and the average sample range was 0.015 yard. Find the 99.73% upper and lower control limits. 2. Below is a table of data sampled twelve times from a process. Plot these data in an X-bar R chart to determine if the process is in statistical control (note: n = 6). Sample# Observations X-bar Range 74.030 74.002 74.019 73.99 74.006 73.999 73.985 74.000 74.001 73.995 73.998 74.000 74.005 74.002 74.050 73.989 74.005 74.030 74.006 74.030 73.995 74.000 73.998 73.990 73.987 73.990 74.004 73.998 74.000 74.002 74.003 73.98 73.998 73.999 73.998 73.995 73.989 74.002 74.008 73.992 74.006 73.999 73.998 74.00 74.001 73.99 73.998 74.000 74.005 74.00 74.001 73.98 74.005 74.030 10 74.004 74.021 73.995 73.990 73.998 73.993 11 73.987 73.995 74.004 73.998 74.000 74.002 12 73.985 73.984 73.998 73.999 73.998 73.995 3. In 5 - 8 sentences, please explain what it means for a process to be in statistical control? What should an organization do if their process is not in statistical control
Step by Step Solution
There are 3 Steps involved in it

Get step-by-step solutions from verified subject matter experts