Question: Question 1 (1 point) What kind of cost involves checking the product or service during its manufacture or provision? Appraisal Cost Intangible Cost Failure Cost
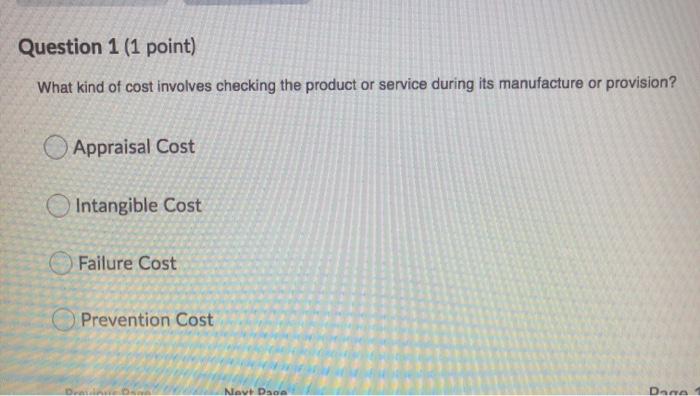
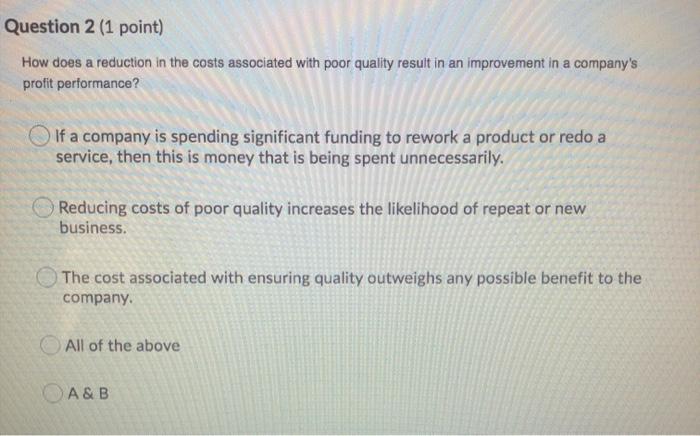
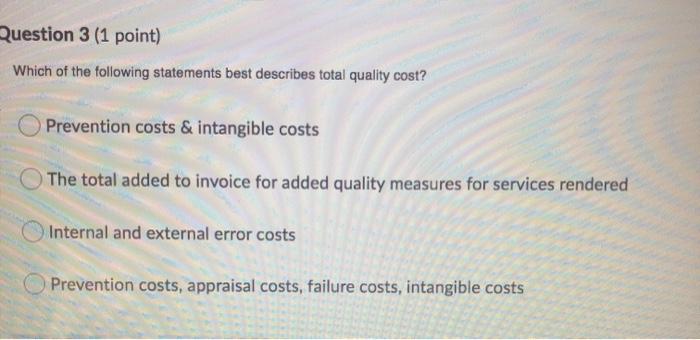
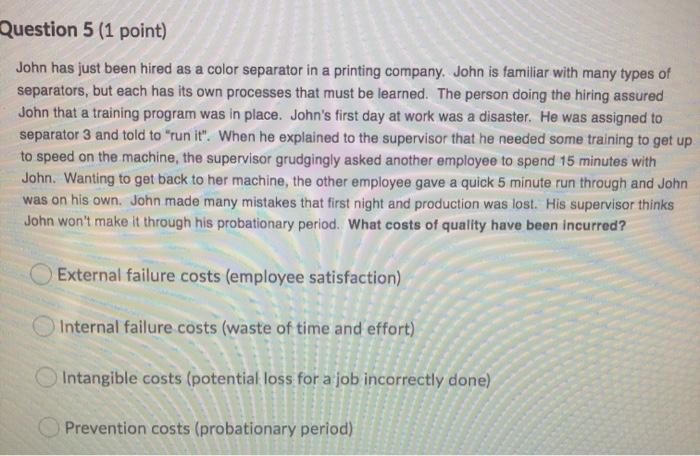
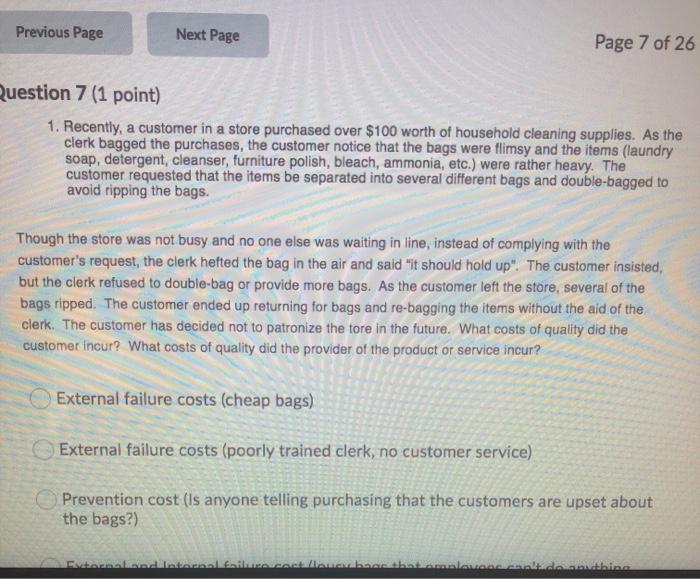
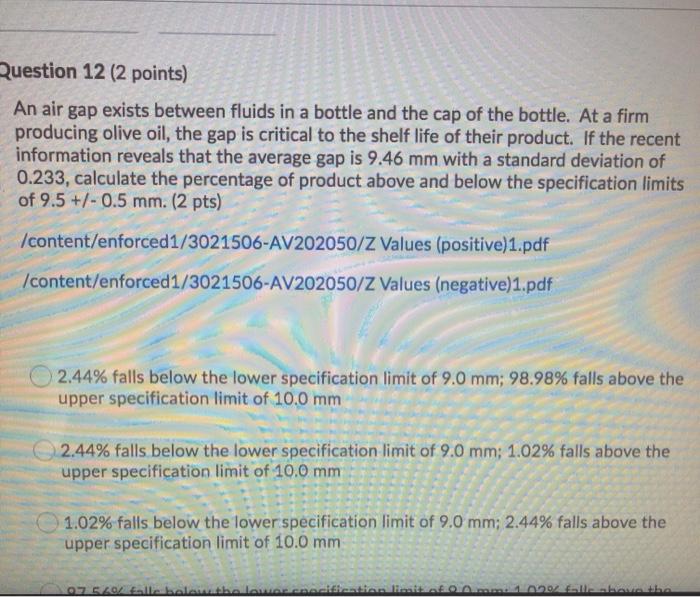
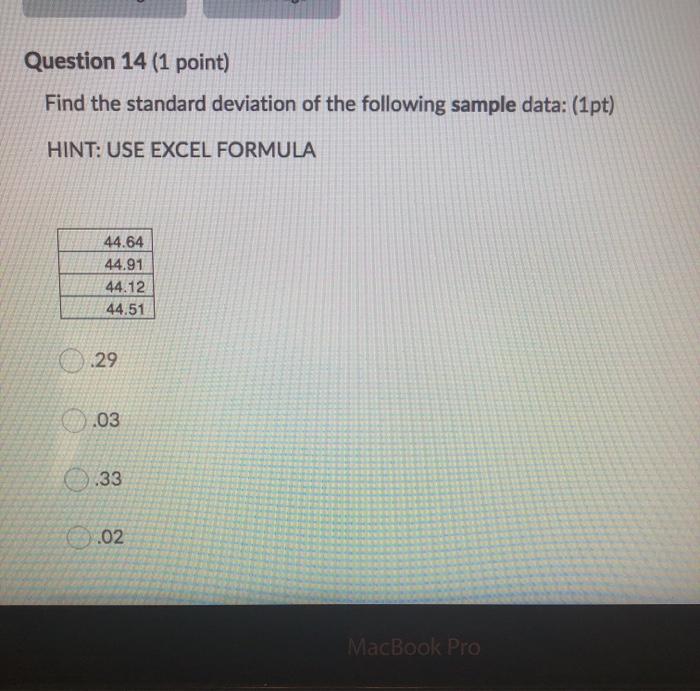
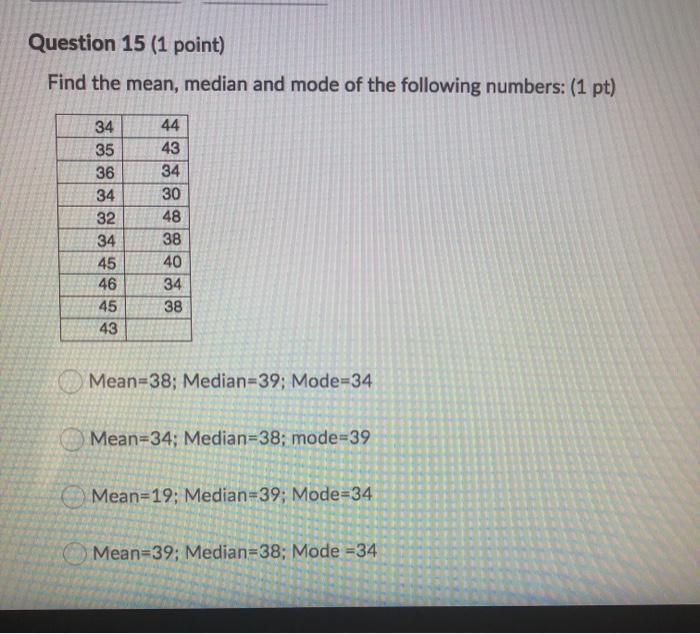
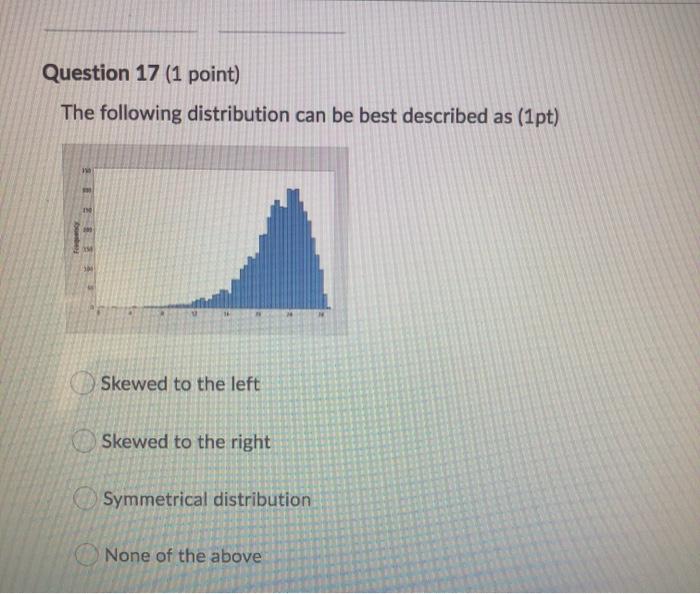
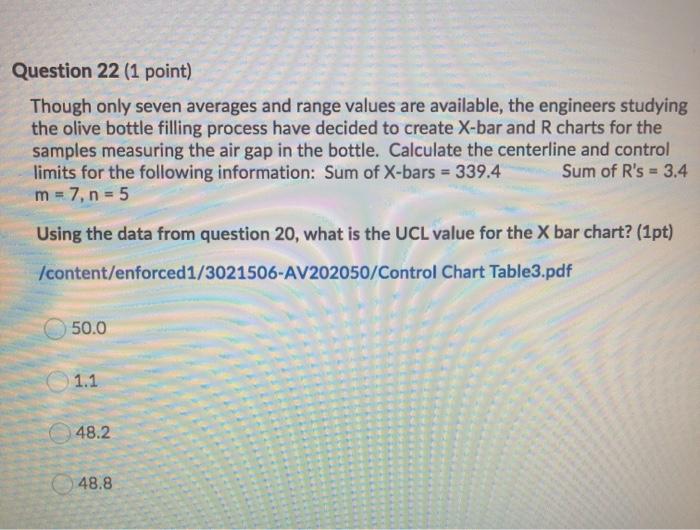
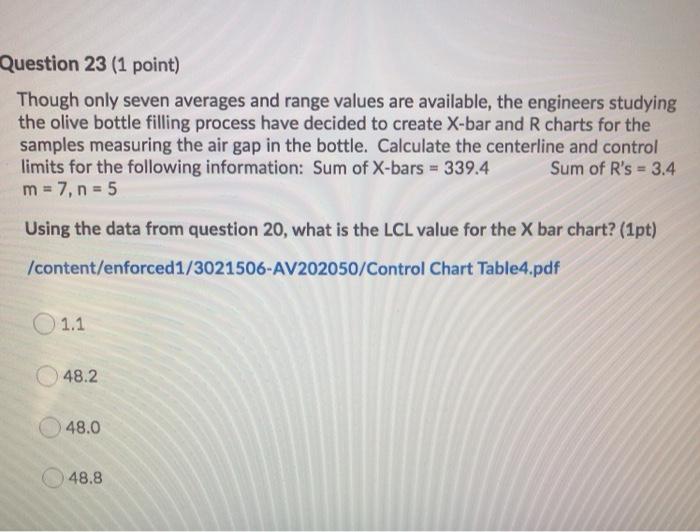
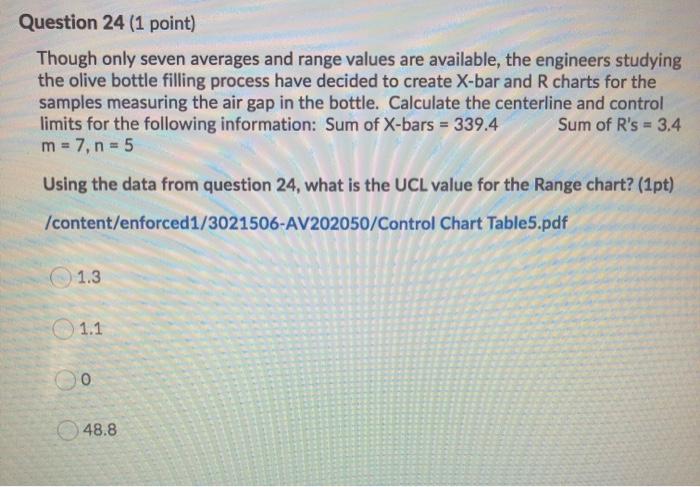
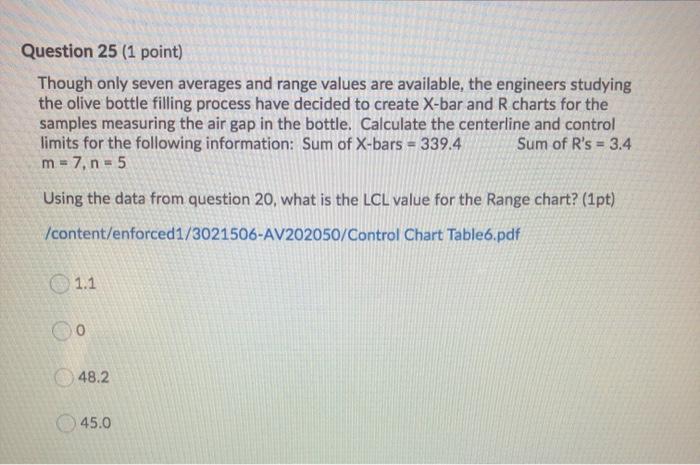
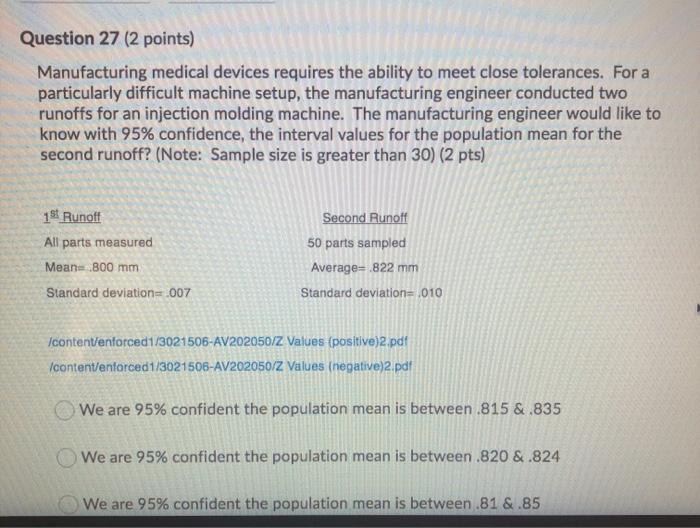
Question 1 (1 point) What kind of cost involves checking the product or service during its manufacture or provision? Appraisal Cost Intangible Cost Failure Cost Prevention Cost Navi Dao Dana Question 2 (1 point) How does a reduction in the costs associated with poor quality result in an improvement in a company's profit performance? If a company is spending significant funding to rework a product or redo a service, then this is money that is being spent unnecessarily. Reducing costs of poor quality increases the likelihood of repeat or new business. The cost associated with ensuring quality outweighs any possible benefit to the company. All of the above A&B Question 3 (1 point) Which of the following statements best describes total quality cost? Prevention costs & intangible costs The total added to invoice for added quality measures for services rendered Internal and external error costs Prevention costs, appraisal costs, failure costs, intangible costs There are 3 components to a balanced Scorecard. They are financial measures, customer measures and learning/growth measures. True False Previous Page Next Page Page 4 of 26 Question 5 (1 point) John has just been hired as a color separator in a printing company. John is familiar with many types of separators, but each has its own processes that must be learned. The person doing the hiring assured John that a training program was in place. John's first day at work was a disaster. He was assigned to separator 3 and told to "run it. When he explained to the supervisor that he needed some training to get up to speed on the machine, the supervisor grudgingly asked another employee to spend 15 minutes with John. Wanting to get back to her machine, the other employee gave a quick 5 minute run through and John was on his own. John made many mistakes that first night and production was lost. His supervisor thinks John won't make it through his probationary period. What costs of quality have been incurred? External failure costs (employee satisfaction) Internal failure costs (waste of time and effort) Intangible costs (potential loss for a job incorrectly done) Prevention costs (probationary period) Employee training is a measure of internal process measurement. True False Question 6 (1 point) Employee training is a measure of internal process measurement. True False Previous Page Next Page Page 7 of 26 Question 7 (1 point) 1. Recently, a customer in a store purchased over $100 worth of household cleaning supplies. As the clerk bagged the purchases, the customer notice that the bags were flimsy and the items (laundry soap, detergent, cleanser, furniture polish, bleach, ammonia, etc.) were rather heavy. The customer requested that the items be separated into several different bags and double-bagged to avoid ripping the bags. Though the store was not busy and no one else was waiting in line, instead of complying with the customer's request, the clerk hefted the bag in the air and said "it should hold up". The customer insisted, but the clerk refused to double-bag or provide more bags. As the customer left the store, several of the bags ripped. The customer ended up returning for bags and re-bagging the items without the aid of the clerk. The customer has decided not to patronize the fore in the future. What costs of quality did the customer incur? What costs of quality did the provider of the product or service incur? External failure costs (cheap bags) External failure costs (poorly trained clerk, no customer service) Prevention cost (Is anyone telling purchasing that the customers are upset about the bags?) bandalavahvendo this Question 8 (1 point) Another name for a why-why diagram is a fishbone diagram. True False DAN Question 9 (1 point) Which of the following is contained within the structure of a fishbone diagram? Topic areas are brainstormed such as material, people, methods, machines, environment and information Root causes can be determined within the causes in the diagram Action planning is done based on the root causes found in the diagram All of the above Only A&B Previous Page Next Page Page 10 of Question 10 (1 point) Determining a root cause is important because: To find the difference between expected performance and actual performance To create a plan of action to correct the problem To find the source of the problem To fix the problem the first time All of the above Question 11 (2 points) One of the dimensions measured when filling bottles of olive oil is the depth of the cork in the bottle. Since the depth of the cork in the bottle affects the size of the air gap in the bottle, this dimension is critical. Its specification is 48.5 +/- 0.5 mm. During a recent day, 35 bottles were inspected for the depth of the cork in the bottle. Create and interpret a histogram using the following information. Use a cell interval of 0.3. Which of the following statements are true? Frequency 2 2 5 6 Size 48.1 48.2 48.3 48.4 48.5 48.6 48.7 48.8 48.9 49 3 5 6 5 0 The standard deviation is 0.9 The cell boundaries are 47.95, 48.25, 48.55, 48.85, 49.15 The cell midpoints are 47.95.48.25, 48.55.48.85.49.15 Question 12 (2 points) An air gap exists between fluids in a bottle and the cap of the bottle. At a firm producing olive oil, the gap is critical to the shelf life of their product. If the recent information reveals that the average gap is 9.46 mm with a standard deviation of 0.233, calculate the percentage of product above and below the specification limits of 9.5 +/- 0.5 mm. (2 pts) /content/enforced1/3021506-AV202050/Z Values (positive)1.pdf /content/enforced 1/3021506-AV202050/Z Values (negative)1.pdf 2.44% falls below the lower specification limit of 9.0 mm; 98.98% falls above the upper specification limit of 10.0 mm 2.44% falls below the lower specification limit of 9.0 mm; 1.02% falls above the upper specification limit of 10.0 mm 1.02% falls below the lower specification limit of 9.0 mm; 2.44% falls above the upper specification limit of 10.0 mm 07 520/ talle halbe lauseeneritation Om faller the Question 13 (2 points) An automotive manufacturer has selected 10 car seats in order to study the Rockwell hardness of the seat recliner mechanism. A sample of 8 has an average of 44.795 and a standard deviation of 0.402. At a 95% confidence level, what is the interval for the population mean? (2 pts) /content/enforced 1/3021506-AV202050/T Values (front)1.pdf /content/enforced1/3021506-AV202050/T Values (back)1.pdf HINT: n=#of samples 45.131, 44.458 44.131, 45.458 O 44.1, 44.4 44.798, 44.796 Question 14 (1 point) Find the standard deviation of the following sample data: (1pt) HINT: USE EXCEL FORMULA 44.64 44.91 44.12 44.51 .29 .03 033 0.02 MacBook Pro Question 15 (1 point) Find the mean, median and mode of the following numbers: (1 pt) 34 35 36 34 32 34 45 46 44 43 34 30 48 38 40 34 38 45 43 Mean=38; Median=39; Mode=34 Mean=34; Median=38; mode=39 Mean=19; Median=39; Mode=34 Mean=39; Median=38; Mode =34 Previous Page Next Page Page 16 of 2 Question 16 (1 point) Accuracy refers to how far the actual or real value the measurement is from the target value. Precision is the ability to repeat a series of measurements and get the same value each time. (1 pt) True False Previous Page Next Page Page 16 of 26 Question 17 (1 point) The following distribution can be best described as (1pt) IN Skewed to the left Skewed to the right Symmetrical distribution None of the above Previous Page Next Page Question 18 (1 point) Which is true regarding a normal distribution? (1 pt) The area under the curve = 1. 50% on the left; 50% on the right 99.73% of all data are observed within 1 standard deviation of the mean The curve is bell shaped and is bimodal The mean, median and mode are not equal Question 19 (1 point) Which of the following statements best describes a process in control: (1pt) A cluster of 7 or more consecutive points above or below the centerline Two thirds of the points are above or below the center value No points are beyond the control limits Points oscillate up and down for 14 points or more All of the above B&C A, B, C Previous Page Next Page Page 20 of Question 20 (1 point) Though only seven averages and range values are available, the engineers studying the olive bottle filling process have decided to create X-bar and R charts for the samples measuring the air gap in the bottle. Calculate the centerline and control limits for the following information: Sum of X-bars = 339.4 Sum of R's = 3.4 m = 7, n = 5 What is the value of the grand average (XDB) for the X bar chart? (1pt) /content/enforced1/3021506-AV202050/Control Chart Table1.pdf 48.4 67.88 0.68 48.5 Question 21 (1 point) Though only seven averages and range values are available, the engineers studying the olive bottle filling process have decided to create X-bar and R charts for the samples measuring the air gap in the bottle. Calculate the centerline and control limits for the following information: Sum of X-bars = 339.4 Sum of R's - 3.4 m = 7, n = 5 Using the data from question 20, what is the centerline value for the R chart? (1pt) /content/enforced1/3021506-AV202050/Control Chart Table2.pdf 0.5 0.6 .005 5 Question 22 (1 point) Though only seven averages and range values are available, the engineers studying the olive bottle filling process have decided to create X-bar and R charts for the samples measuring the air gap in the bottle. Calculate the centerline and control limits for the following information: Sum of X-bars = 339.4 Sum of R's = 3.4 m-7, n = 5 Using the data from question 20, what is the UCL value for the X bar chart? (1pt) /content/enforced1/3021506-AV202050/Control Chart Table3.pdf 50.0 1.1 48.2 48.8 Question 23 (1 point) Though only seven averages and range values are available, the engineers studying the olive bottle filling process have decided to create X-bar and R charts for the samples measuring the air gap in the bottle. Calculate the centerline and control limits for the following information: Sum of X-bars = 339.4 Sum of R's = 3.4 m = 7, n = 5 Using the data from question 20, what is the LCL value for the X bar chart? (1pt) /content/enforced1/3021506-AV202050/Control Chart Table4.pdf 1.1 48.2 48.0 48.8 Question 24 (1 point) Though only seven averages and range values are available, the engineers studying the olive bottle filling process have decided to create X-bar and R charts for the samples measuring the air gap in the bottle. Calculate the centerline and control limits for the following information: Sum of X-bars = 339.4 Sum of R's = 3.4 m = 7, n = 5 Using the data from question 24, what is the UCL value for the Range chart? (1pt) /content/enforced1/3021506-AV202050/Control Chart Table5.pdf 1.3 O 1.1 00 48.8 Question 25 (1 point) Though only seven averages and range values are available, the engineers studying the olive bottle filling process have decided to create X-bar and R charts for the samples measuring the air gap in the bottle. Calculate the centerline and control limits for the following information: Sum of X-bars = 339.4 Sum of R's = 3.4 m = 7, n = 5 Using the data from question 20, what is the LCL value for the Range chart? (1pt) /content/enforced1/3021506-AV202050/Control Chart Table6.pdf 1.1 0 48.2 45.0 Question 26 (1 point) Which of the following is true regarding control charts: (1 pt) The high and low values in the sample are used to determine standard deviation in a control chart using standard deviation The formula for finding the LCL on a standard deviation control chart does not include finding the grand average of the averages of each subgroup. O A control chart using standard deviation is more accurate than a range control chart When the sample size is less than 10, a control chart using standard deviation should be used rather than a range control chart Question 27 (2 points) Manufacturing medical devices requires the ability to meet close tolerances. For a particularly difficult machine setup, the manufacturing engineer conducted two runoffs for an injection molding machine. The manufacturing engineer would like to know with 95% confidence, the interval values for the population mean for the second runoff? (Note: Sample size is greater than 30) (2 pts) 18 Runoff All parts measured Mean. 800 mm Standard deviation-007 Second Runoft 50 parts sampled Average= 822 mm Standard deviation=010 /content/enforced1/3021506-AV202050/2 Values (positive)2.pdf /content/enforced 1/3021506-AV202050/Z Values (negative)2.pdf We are 95% confident the population mean is between 815 &.835 We are 95% confident the population mean is between 820 &.824 We are 95% confident the population mean is between 81 &.85 Question 28 (1 point) Results measures are the activities that must take place in order to produce a product or provide a service. Process measures relate to both organizations and their customers and are tied to organizational objectives and what the customer hopes to achieve by doing business with the organization. True False Previous Page Next Page Page 23 of 26 Question 29 (1 point) Who coined the principle "80% of problems can be attributed to 20% of causes and encouraged management to work on "vital few" causes or root causes?" Dr, Deming Dr. Juran Dr. Shewhart Dr. Smith Previous Page Next Page Page 25 of 26 Question 30 (1 point) When deciding upon the number of observations in a process, it is always better to measure the entire population as it is most cost effective. True False Previous Page Next Page Page 26 of 26 Question 31 (1 point) Measures of dispersion, the range and standard deviation, refer to the spread of the data. The range and standard deviation enable those studying a process to understand how much variation is present in the process. True False