

constuct a graph of strain rate versus distance to the west of stable N. amriac. plot strain
Fantastic news! We've Found the answer you've been seeking!
Question:
constuct a graph of strain rate versus distance to the west of stable N. amriac. plot strain rate for each postion (i.e, neighboring pair of vectors) this can be done redily using the table you built in excel for the previous question. Recall that strain rate is ( change in length)/(original length)/time. change in length is the diffrent in vector lengthd and orignal length is distance between benchmarks. these values can quickly be calculated in excel. mark the location of the N Amraica- pacific plate boundary on the graph.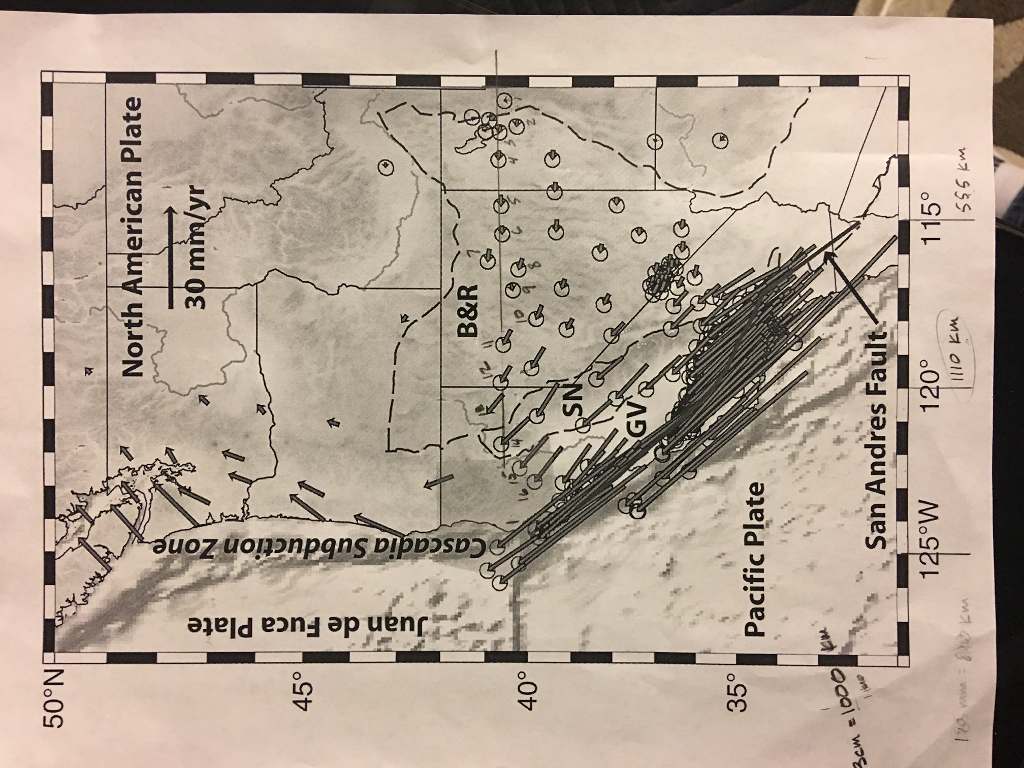
Expert Answer:

Related Book For 

Posted Date:
