

Question: Content * Take Test: Lesson 8-9 Quiz - 225 | > *Dashboard C gc.blackboard.com/webapps/assessment/take/launch.jsp?course_assessment_id=_262273_1&course_id=_335734_1&content_id=_7231634_1&step=null CDI MyCampus LMIA Processing Ce.. Online applications CICC Apply for Canadian..
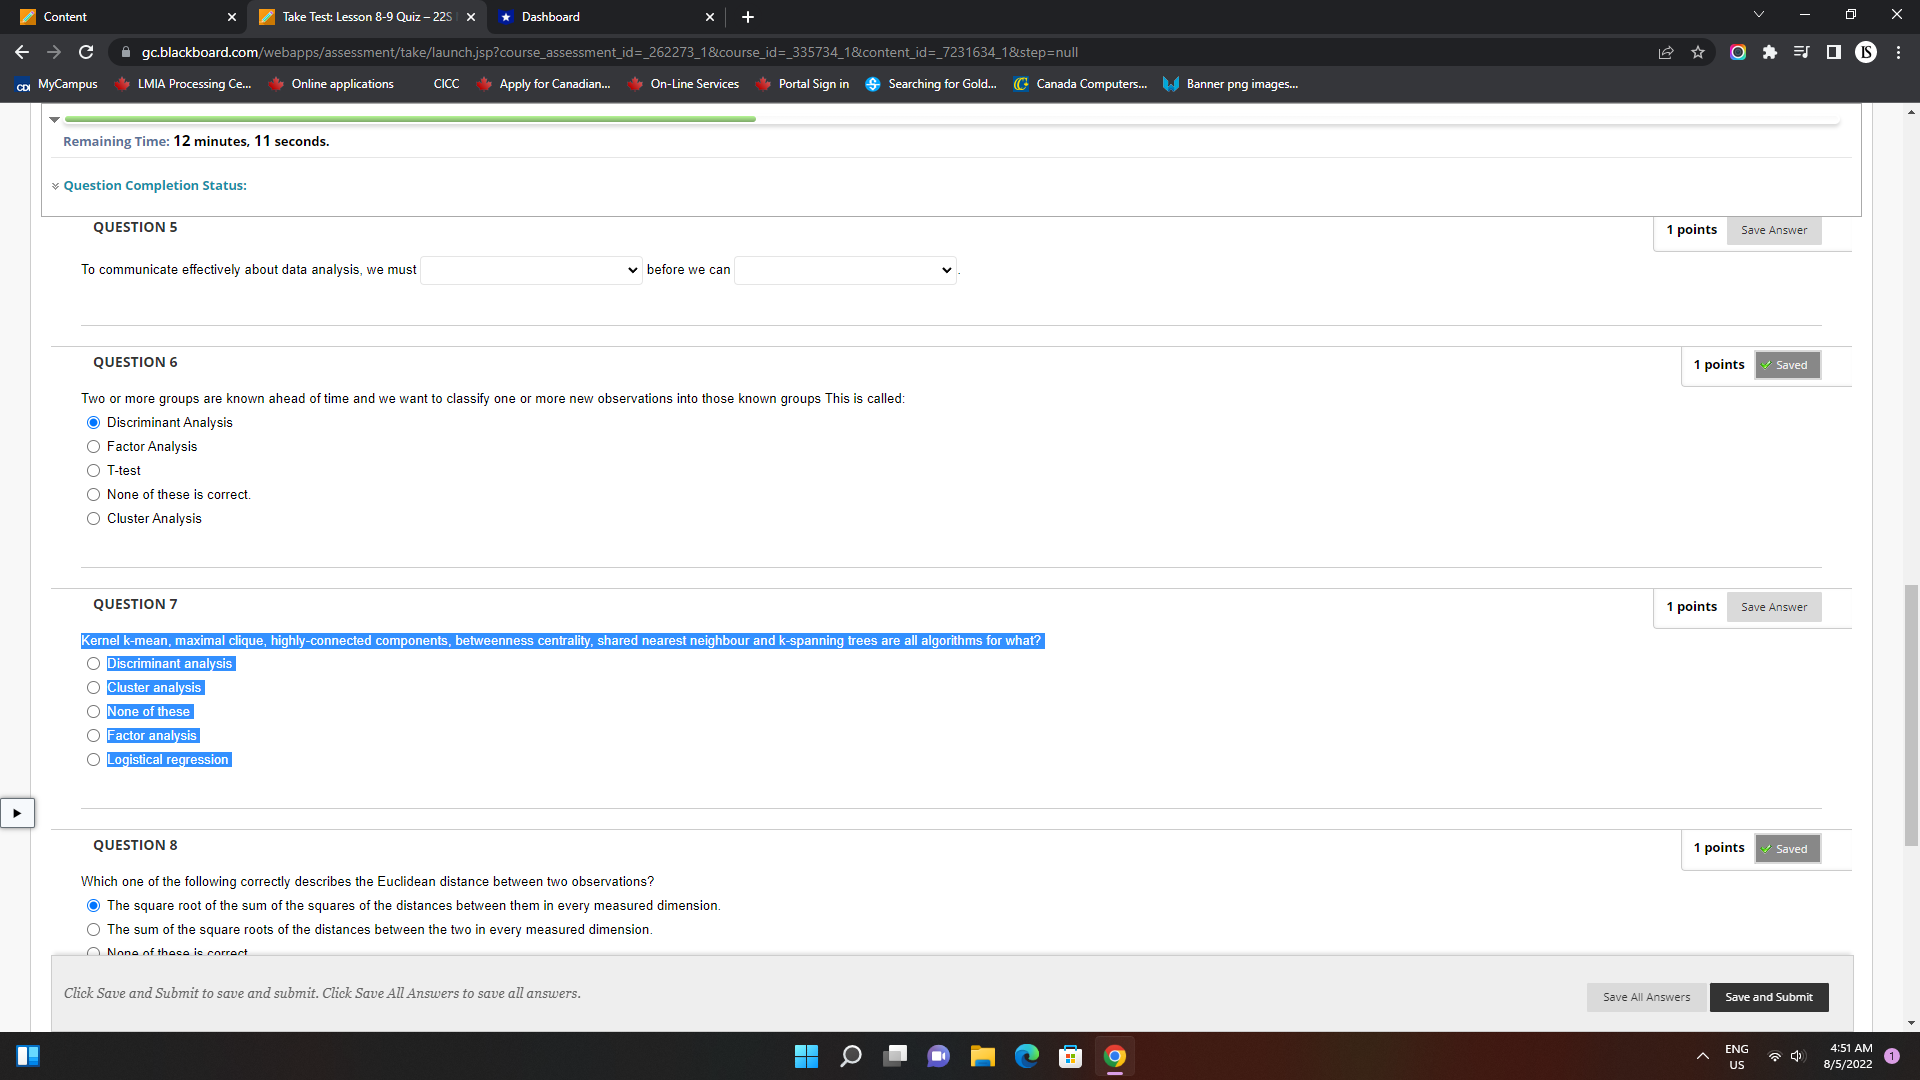
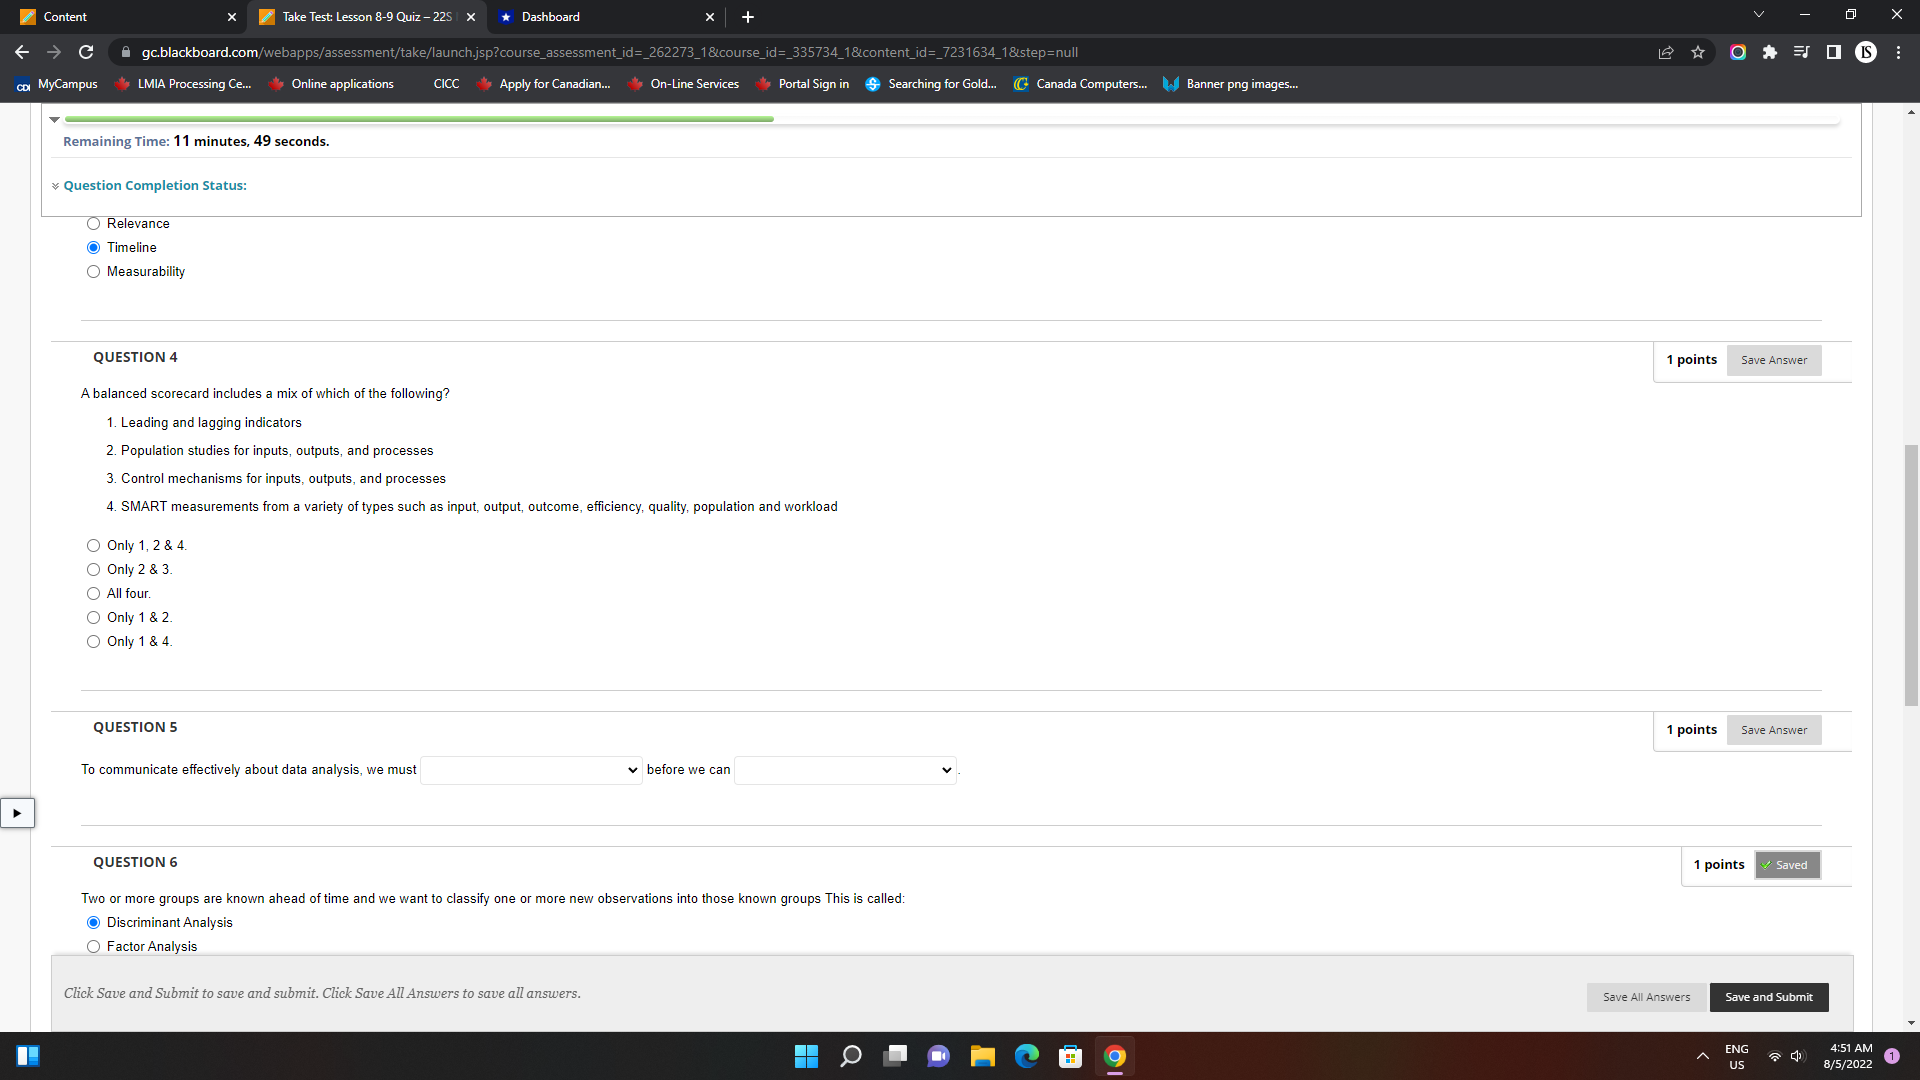
Content * Take Test: Lesson 8-9 Quiz - 225 | > *Dashboard C gc.blackboard.com/webapps/assessment/take/launch.jsp?course_assessment_id=_262273_1&course_id=_335734_1&content_id=_7231634_1&step=null CDI MyCampus LMIA Processing Ce.. Online applications CICC Apply for Canadian.. On-Line Services Portal Sign in S Searching for Gold. C Canada Computers. Banner png images. Remaining Time: 12 minutes, 11 seconds. Question Completion Status: QUESTION 5 1 points Save Answer To communicate effectively about data analysis, we must v before we can QUESTION 6 1 points Saved Two or more groups are known ahead of time and we want to classify one or more new observations into those known groups This is called: O Discriminant Analysis O Factor Analysis O T-test None of these is correct. O Cluster Analysis QUESTION 7 1 points Save Answer Kernel k-mean, maximal clique, highly-connected components, betweenness centrality, shared nearest neighbour and k-spanning trees are all algorithms for what? Discriminant analysis Cluster analysis O None of these O Factor analysis Logistical regression QUESTION 8 1 points Saved Which one of the following correctly describes the Euclidean distance between two observations? The square root of the sum of the squares of the distances between them in every measured dimension. The sum of the square roots of the distances between the two in every measured dimension. O None of these is correct Click Save and Submit to save and submit. Click Save All Answers to save all answers. Save All Answers Save and Submit T ENG 4:51 AM US 8/5/2022 1Content * Take Test: Lesson 8-9 Quiz - 225 1 > *Dashboard C gc.blackboard.com/webapps/assessment/take/launch.jsp?course_assessment_id=_262273_1&course_id=_335734_1&content_id=_7231634_1&step=null CDI MyCampus LMIA Processing Ce.. Online applications CICC Apply for Canadian. On-Line Services Portal Sign in S Searching for Gold.. C Canada Computers.. Banner png images.. Remaining Time: 11 minutes, 49 seconds. Question Completion Status: O Relevance O Timeline O Measurability QUESTION 4 1 points Save Answer A balanced scorecard includes a mix of which of the following? 1. Leading and lagging indicators 2. Population studies for inputs, outputs, and processes 3. Control mechanisms for inputs, outputs, and processes 4. SMART measurements from a variety of types such as input, output, outcome, efficiency, quality, population and workload O Only 1, 2 & 4. O Only 2 & 3. All four. O Only 1 & 2. O Only 1 & 4. QUESTION 5 1 points Save Answer To communicate effectively about data analysis, we must v before we can QUESTION 6 1 points Saved Two or more groups are known ahead of time and we want to classify one or more new observations into those known groups This is called: O Discriminant Analysis O Factor Analysis Click Save and Submit to save and submit. Click Save All Answers to save all answers. Save All Answers Save and Submit T ENG 4:51 AM US 8/5/2022 1
Step by Step Solution
There are 3 Steps involved in it

Get step-by-step solutions from verified subject matter experts