

Question: Contingency table results: Rows: Happiness Columns: Exam Score Cell format Count (Column percent) (Expected count) (Contributions to Chi-Square) Excellent Good Fair Poor Total Very Happy
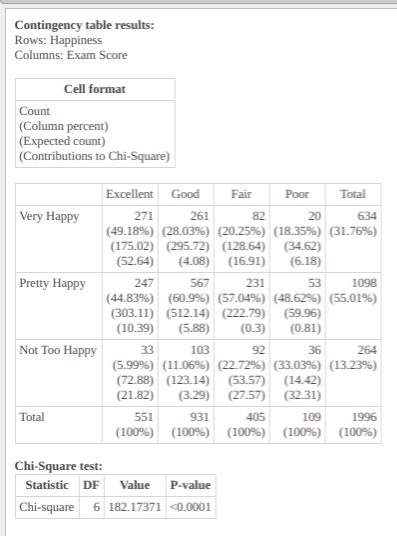
Contingency table results: Rows: Happiness Columns: Exam Score Cell format Count (Column percent) (Expected count) (Contributions to Chi-Square) Excellent Good Fair Poor Total Very Happy 271 261 82 20 634 (49.18%) (28.03%) (20.25%) (18.35%) (31.76%) (175.02) (295.72) (128.64) (34.62) (52.64) (4.08) (16.91) (6.18) Pretty Happy 247 567 231 53 1098 (44.83%) (60.9%) (57.04%) (48.62%) (55.01%) (303.11) (512.14) (222.79) (59.96) (10.39) (5.88) (0.3) (0.81) Not Too Happy 33 103 92 36 264 (5.99%) (11.06%) (22.72%) (33.03%) (13.23%) (72.88) (123.14) (53.57) (14.42) (21.82) (3.29) (27.57) (32.31) Total 551 931 405 109 1996 (100%) (100%) (100%) (100%) (100%) Chi-Square test: Statistic DF Value P-value Chi-square 6 182.17371
Step by Step Solution
There are 3 Steps involved in it

Get step-by-step solutions from verified subject matter experts