

Question: Continuation of problem Variable 2: Variable 3: Variable 4: Variable 5: Graphs and/or Tables Table 3. Type of Graphs and/or Tables for Selected Variables Variable
Continuation of problem
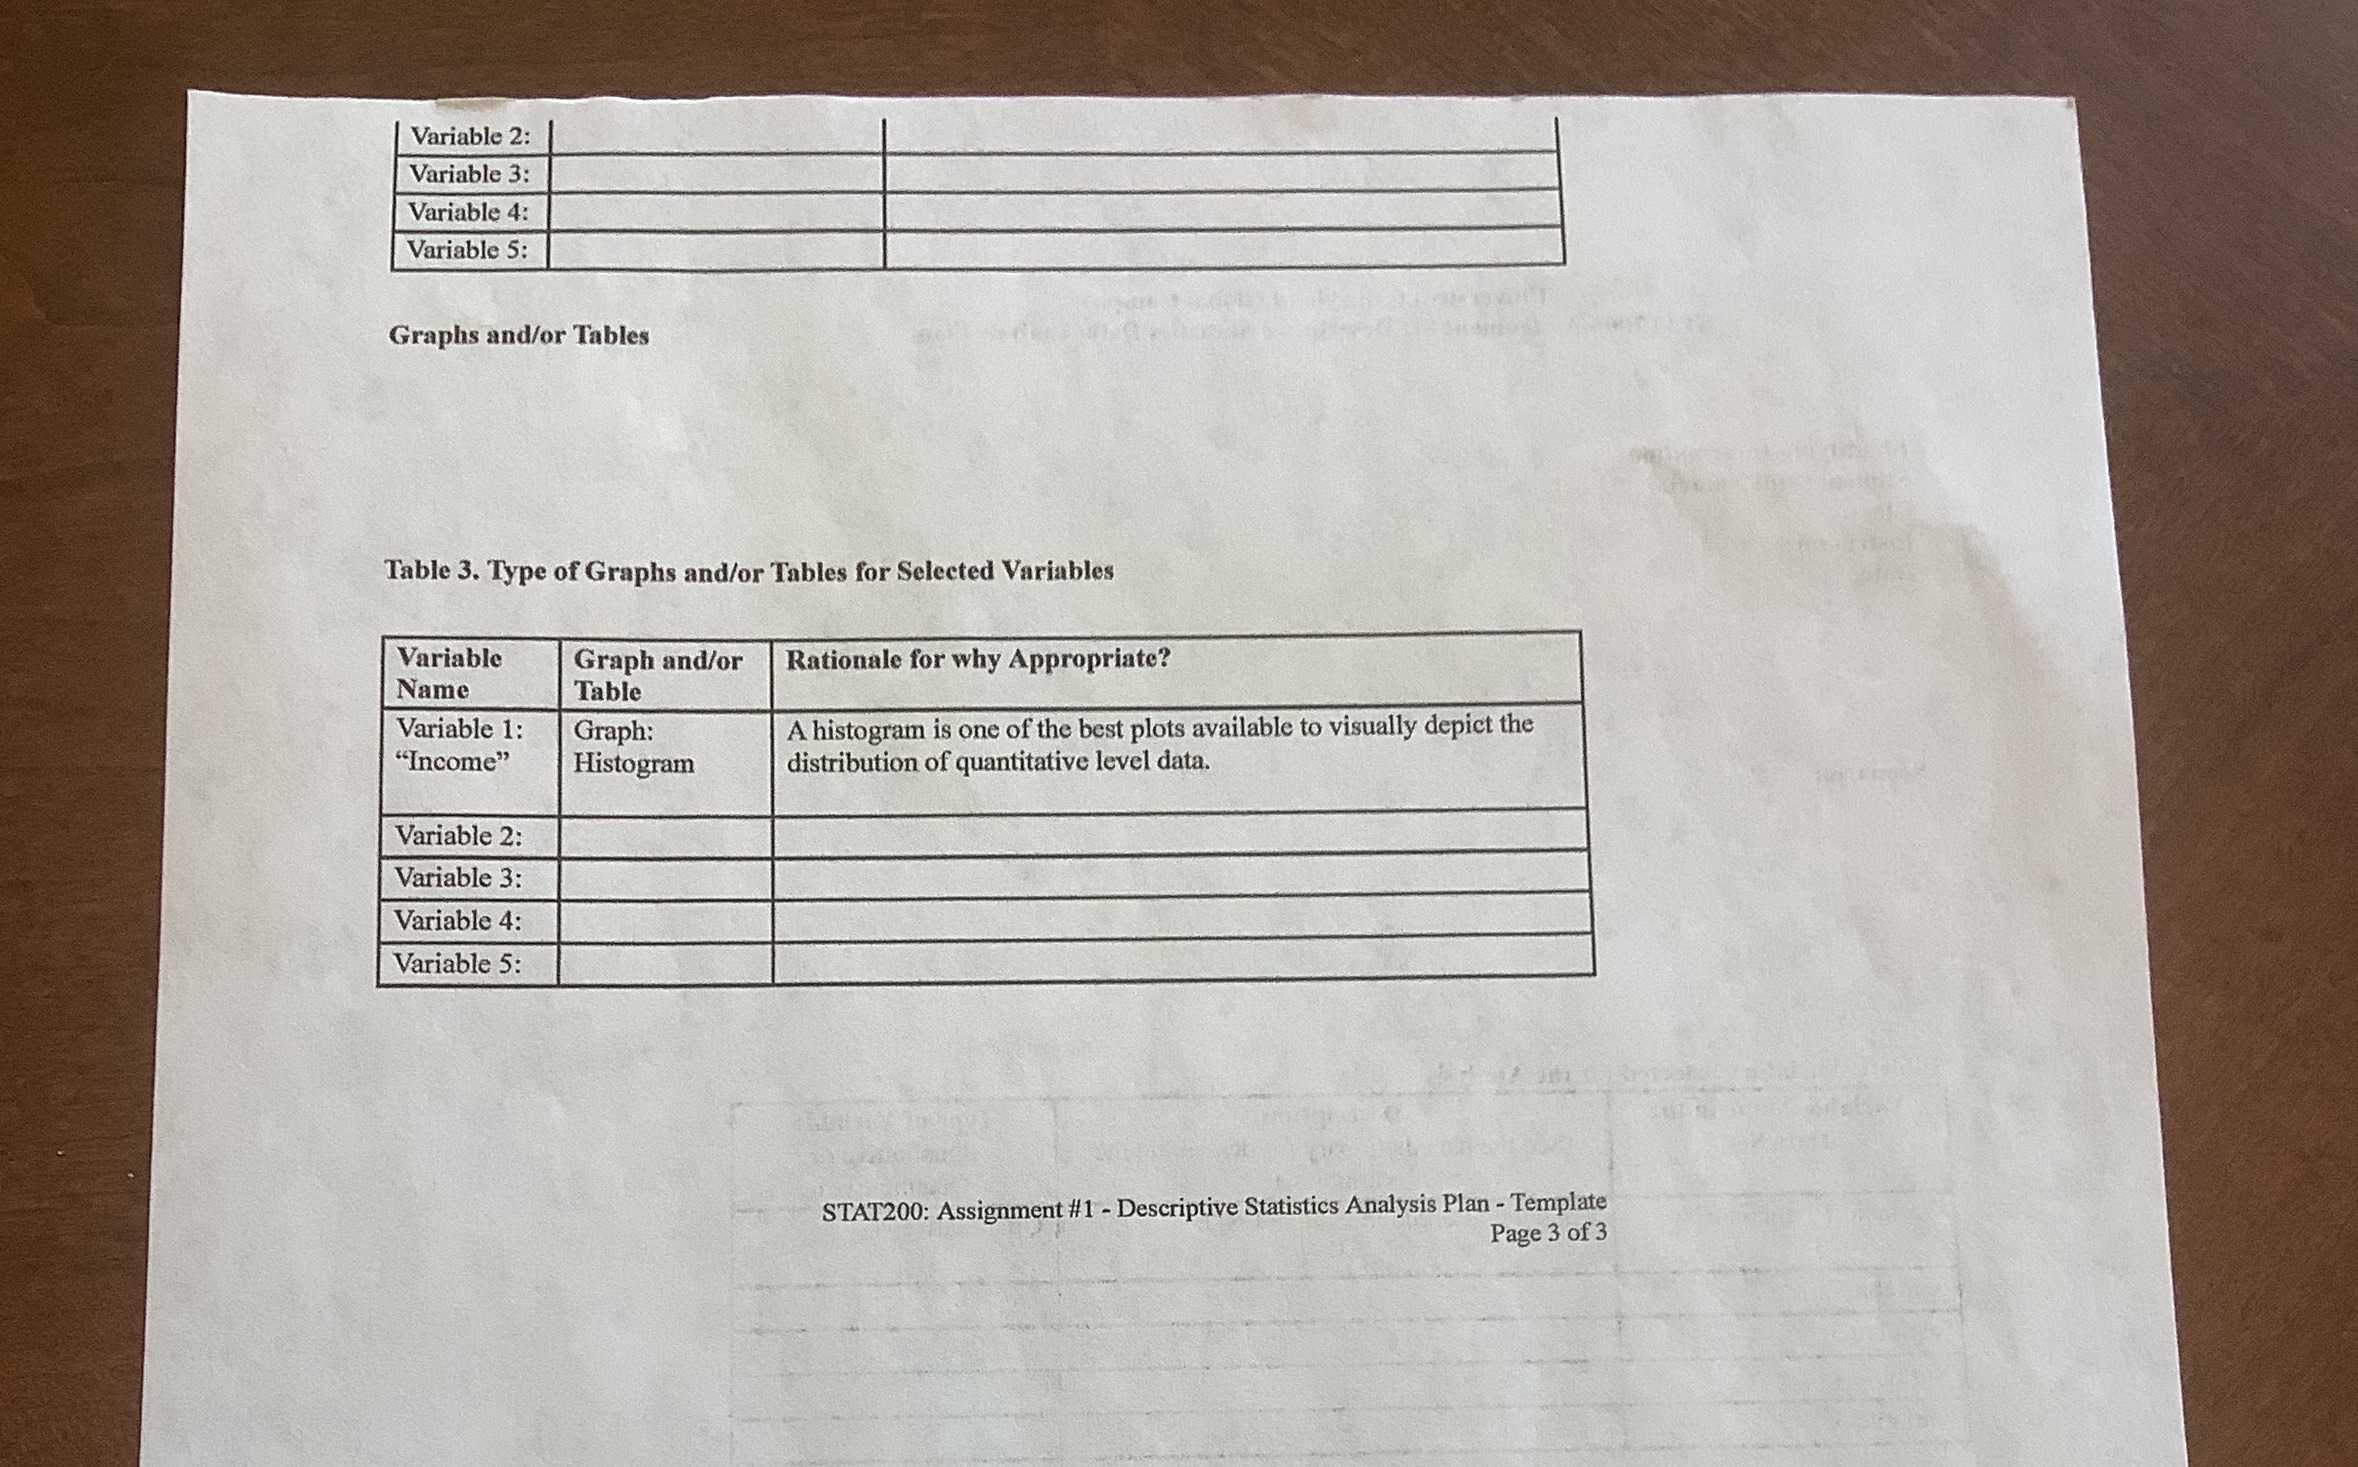
Variable 2: Variable 3: Variable 4: Variable 5: Graphs and/or Tables Table 3. Type of Graphs and/or Tables for Selected Variables Variable Graph and/or Rationale for why Appropriate? Name Table Variable 1: Graph: A histogram is one of the best plots available to visually depict the "Income" Histogram distribution of quantitative level data. Variable 2: Variable 3: Variable 4: Variable 5: STAT200: Assignment #1 - Descriptive Statistics Analysis Plan - Template Page 3 of 3
Step by Step Solution
There are 3 Steps involved in it
1 Expert Approved Answer
Step: 1 Unlock

Question Has Been Solved by an Expert!
Get step-by-step solutions from verified subject matter experts
Step: 2 Unlock
Step: 3 Unlock