

Question: continue to use the samplingweightsin the perwt variable for all regressions. 3. (24 points) The sample already includes only full-time workers, defined as those
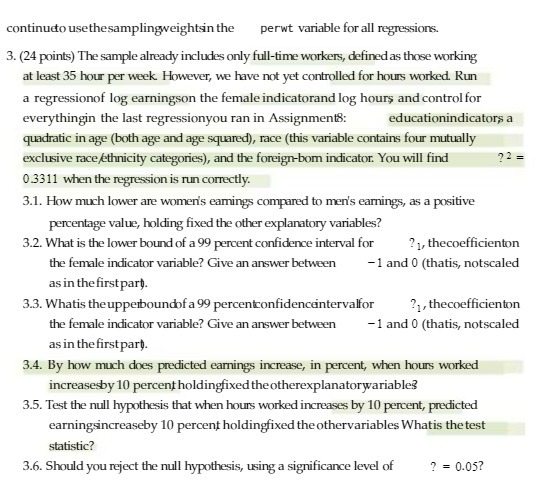
continue to use the samplingweightsin the perwt variable for all regressions. 3. (24 points) The sample already includes only full-time workers, defined as those working at least 35 hour per week. However, we have not yet controlled for hours worked. Run a regressionof log earningson the female indicatorand log hours and control for everythingin the last regressionyou ran in Assignment8: educationindicators a quadratic in age (both age and age squared), race (this variable contains four mutually exclusive race/ethnicity categories), and the foreign-bom indicator. You will find 0.3311 when the regression is run correctly. 3.1. How much lower are women's earnings compared to men's earnings, as a positive percentage value, holding fixed the other explanatory variables? 3.2. What is the lower bound of a 99 percent confidence interval for 21, thecoefficienton the female indicator variable? Give an answer between -1 and 0 (thatis, notscaled as in the first part. 3.3. Whatis the upperbound of a 99 percentconfidenceintervalfor 21, thecoefficienton the female indicator variable? Give an answer between -1 and 0 (thatis, notscaled as in the first part. 3.4. By how much does predicted earnings increase, in percent, when hours worked increasesby 10 percent holdingfixed the otherexplanatorwariable? 3.5. Test the null hypothesis that when hours worked increases by 10 percent, predicted earningsincreaseby 10 percent holdingfixed the othervariables What is the test statistic? 3.6. Should you reject the null hypothesis, using a significance level of ? = 0.05?
Step by Step Solution
3.36 Rating (143 Votes )
There are 3 Steps involved in it
To address your questions 31 To calculate the percentage difference you can use the formula frace033... View full answer

Get step-by-step solutions from verified subject matter experts