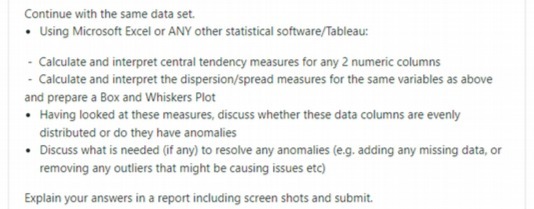
Question: Continue with the same data set. . Using Microsoft Excel or ANY other statistical software/Tableau: - Calculate and interpret central tendency measures for any 2

Continue with the same data set. . Using
Continue with the same data set. . Using Microsoft Excel or ANY other statistical software/Tableau: - Calculate and interpret central tendency measures for any 2 numeric columns - Calculate and interpret the dispersion/spread measures for the same variables as above and prepare a Box and Whiskers Plot . Having looked at these measures, discuss whether these data columns are evenly distributed or do they have anomalies . Discuss what is needed (if any) to resolve any anomalies (e.g. adding any missing data, or removing any outliers that might be causing issues etc) Explain your answers in a report including screen shots and submit

Step by Step Solution

There are 3 Steps involved in it

1 Expert Approved Answer
Step: 1 Unlock blur-text-image
Question Has Been Solved by an Expert!

Get step-by-step solutions from verified subject matter experts

Step: 2 Unlock
Step: 3 Unlock

Students Have Also Explored These Related Mathematics Questions!