

Question: Continue with the same data set. Using Microsoft Excel or any other statistical software: - Calculate and interpret central tendency measures for any 2 numeric
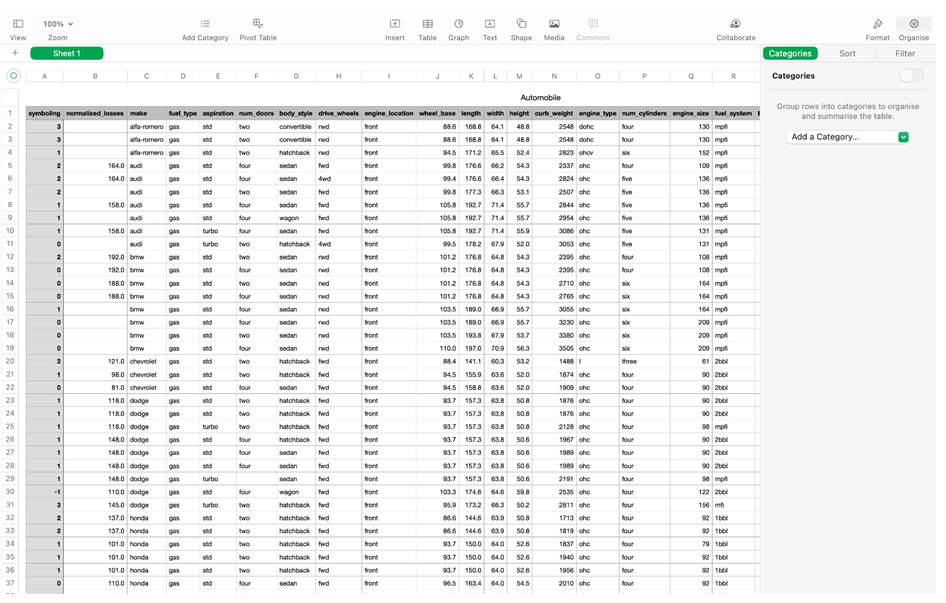 Continue with the same data set.
Using Microsoft Excel or any other statistical software:
- Calculate and interpret central tendency measures for any 2 numeric columns - Calculate and interpret the dispersion/spread measures for the same variables as above and prepare a Box and Whiskers Plot
Having looked at these measures, discuss whether these data columns are evenly distributed or do they have anomalies
Discuss what is needed (if any) to resolve any anomalies (e.g. adding any missing data, or removing any outliers that might be causing issues etc)
Explain your answers in a report including screen shots and submit.
Group rows into categories to organise and summarise the table. Group rows into categories to organise and summarise the table
Step by Step Solution
There are 3 Steps involved in it

Get step-by-step solutions from verified subject matter experts