

Question: Continue with the toy forecast. Forecast using a simple linear regression. Give the missing values. Linear intercept A Slope B Sales of Plush Toys Forecast
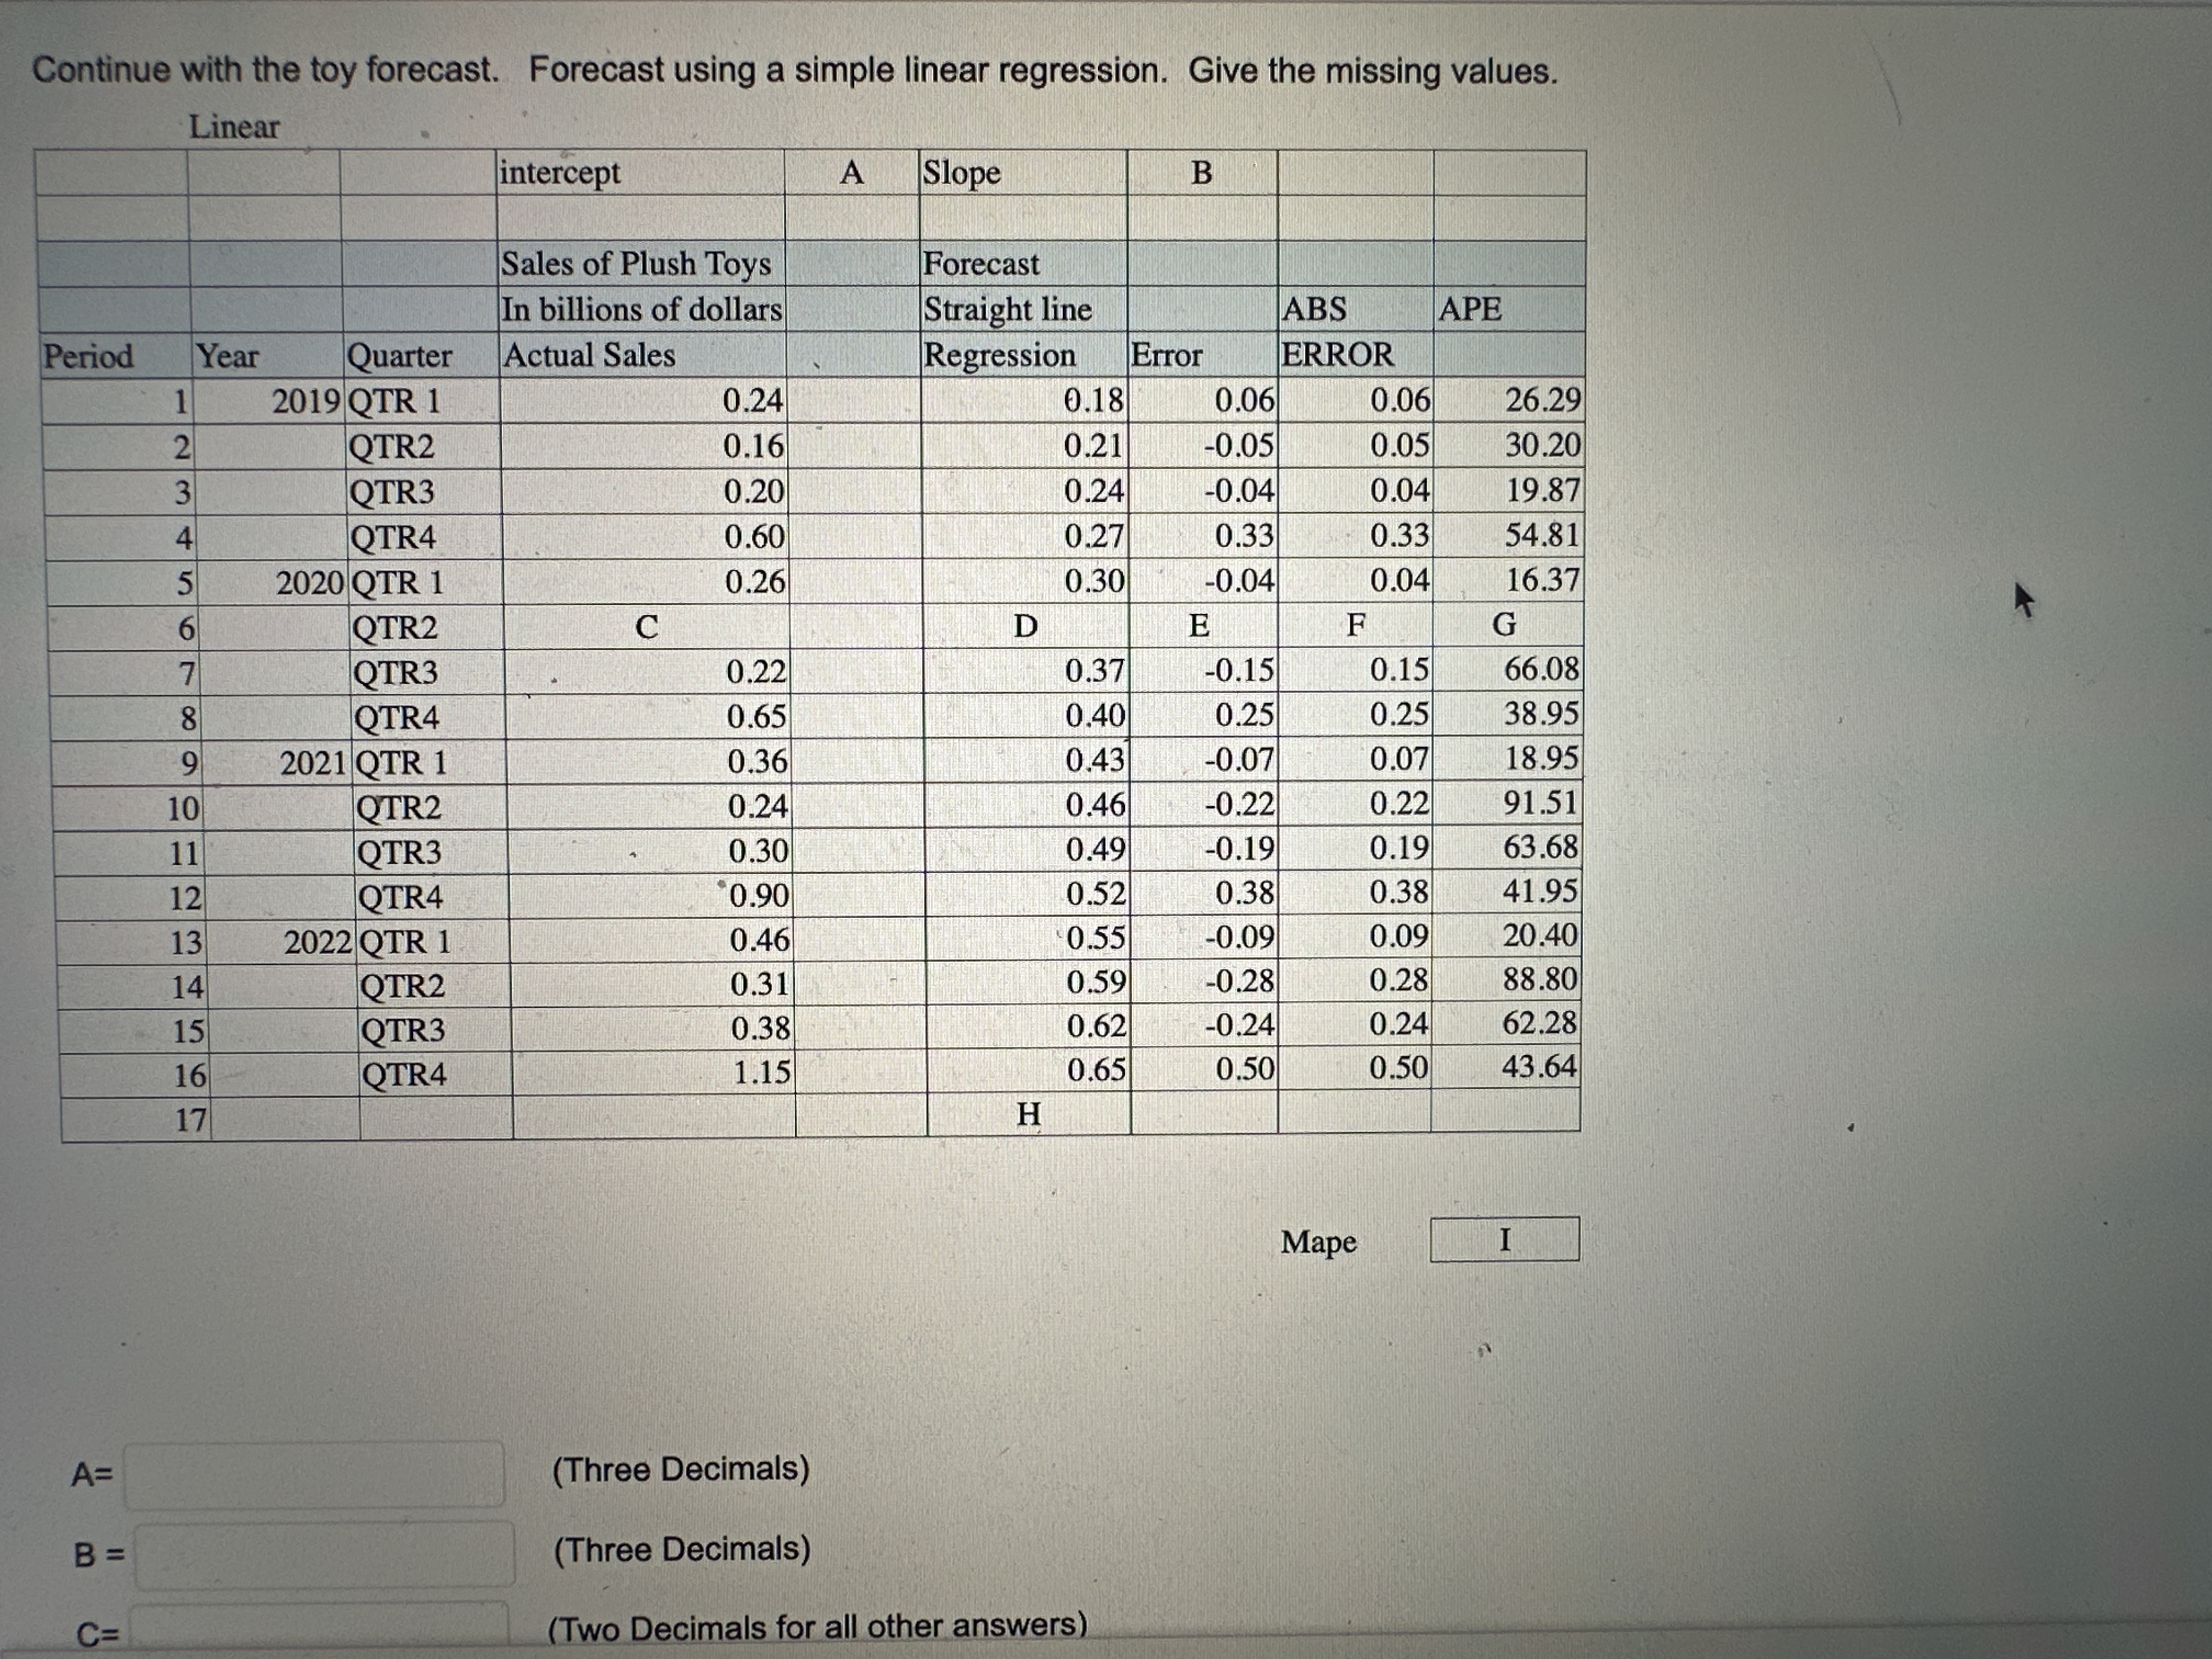
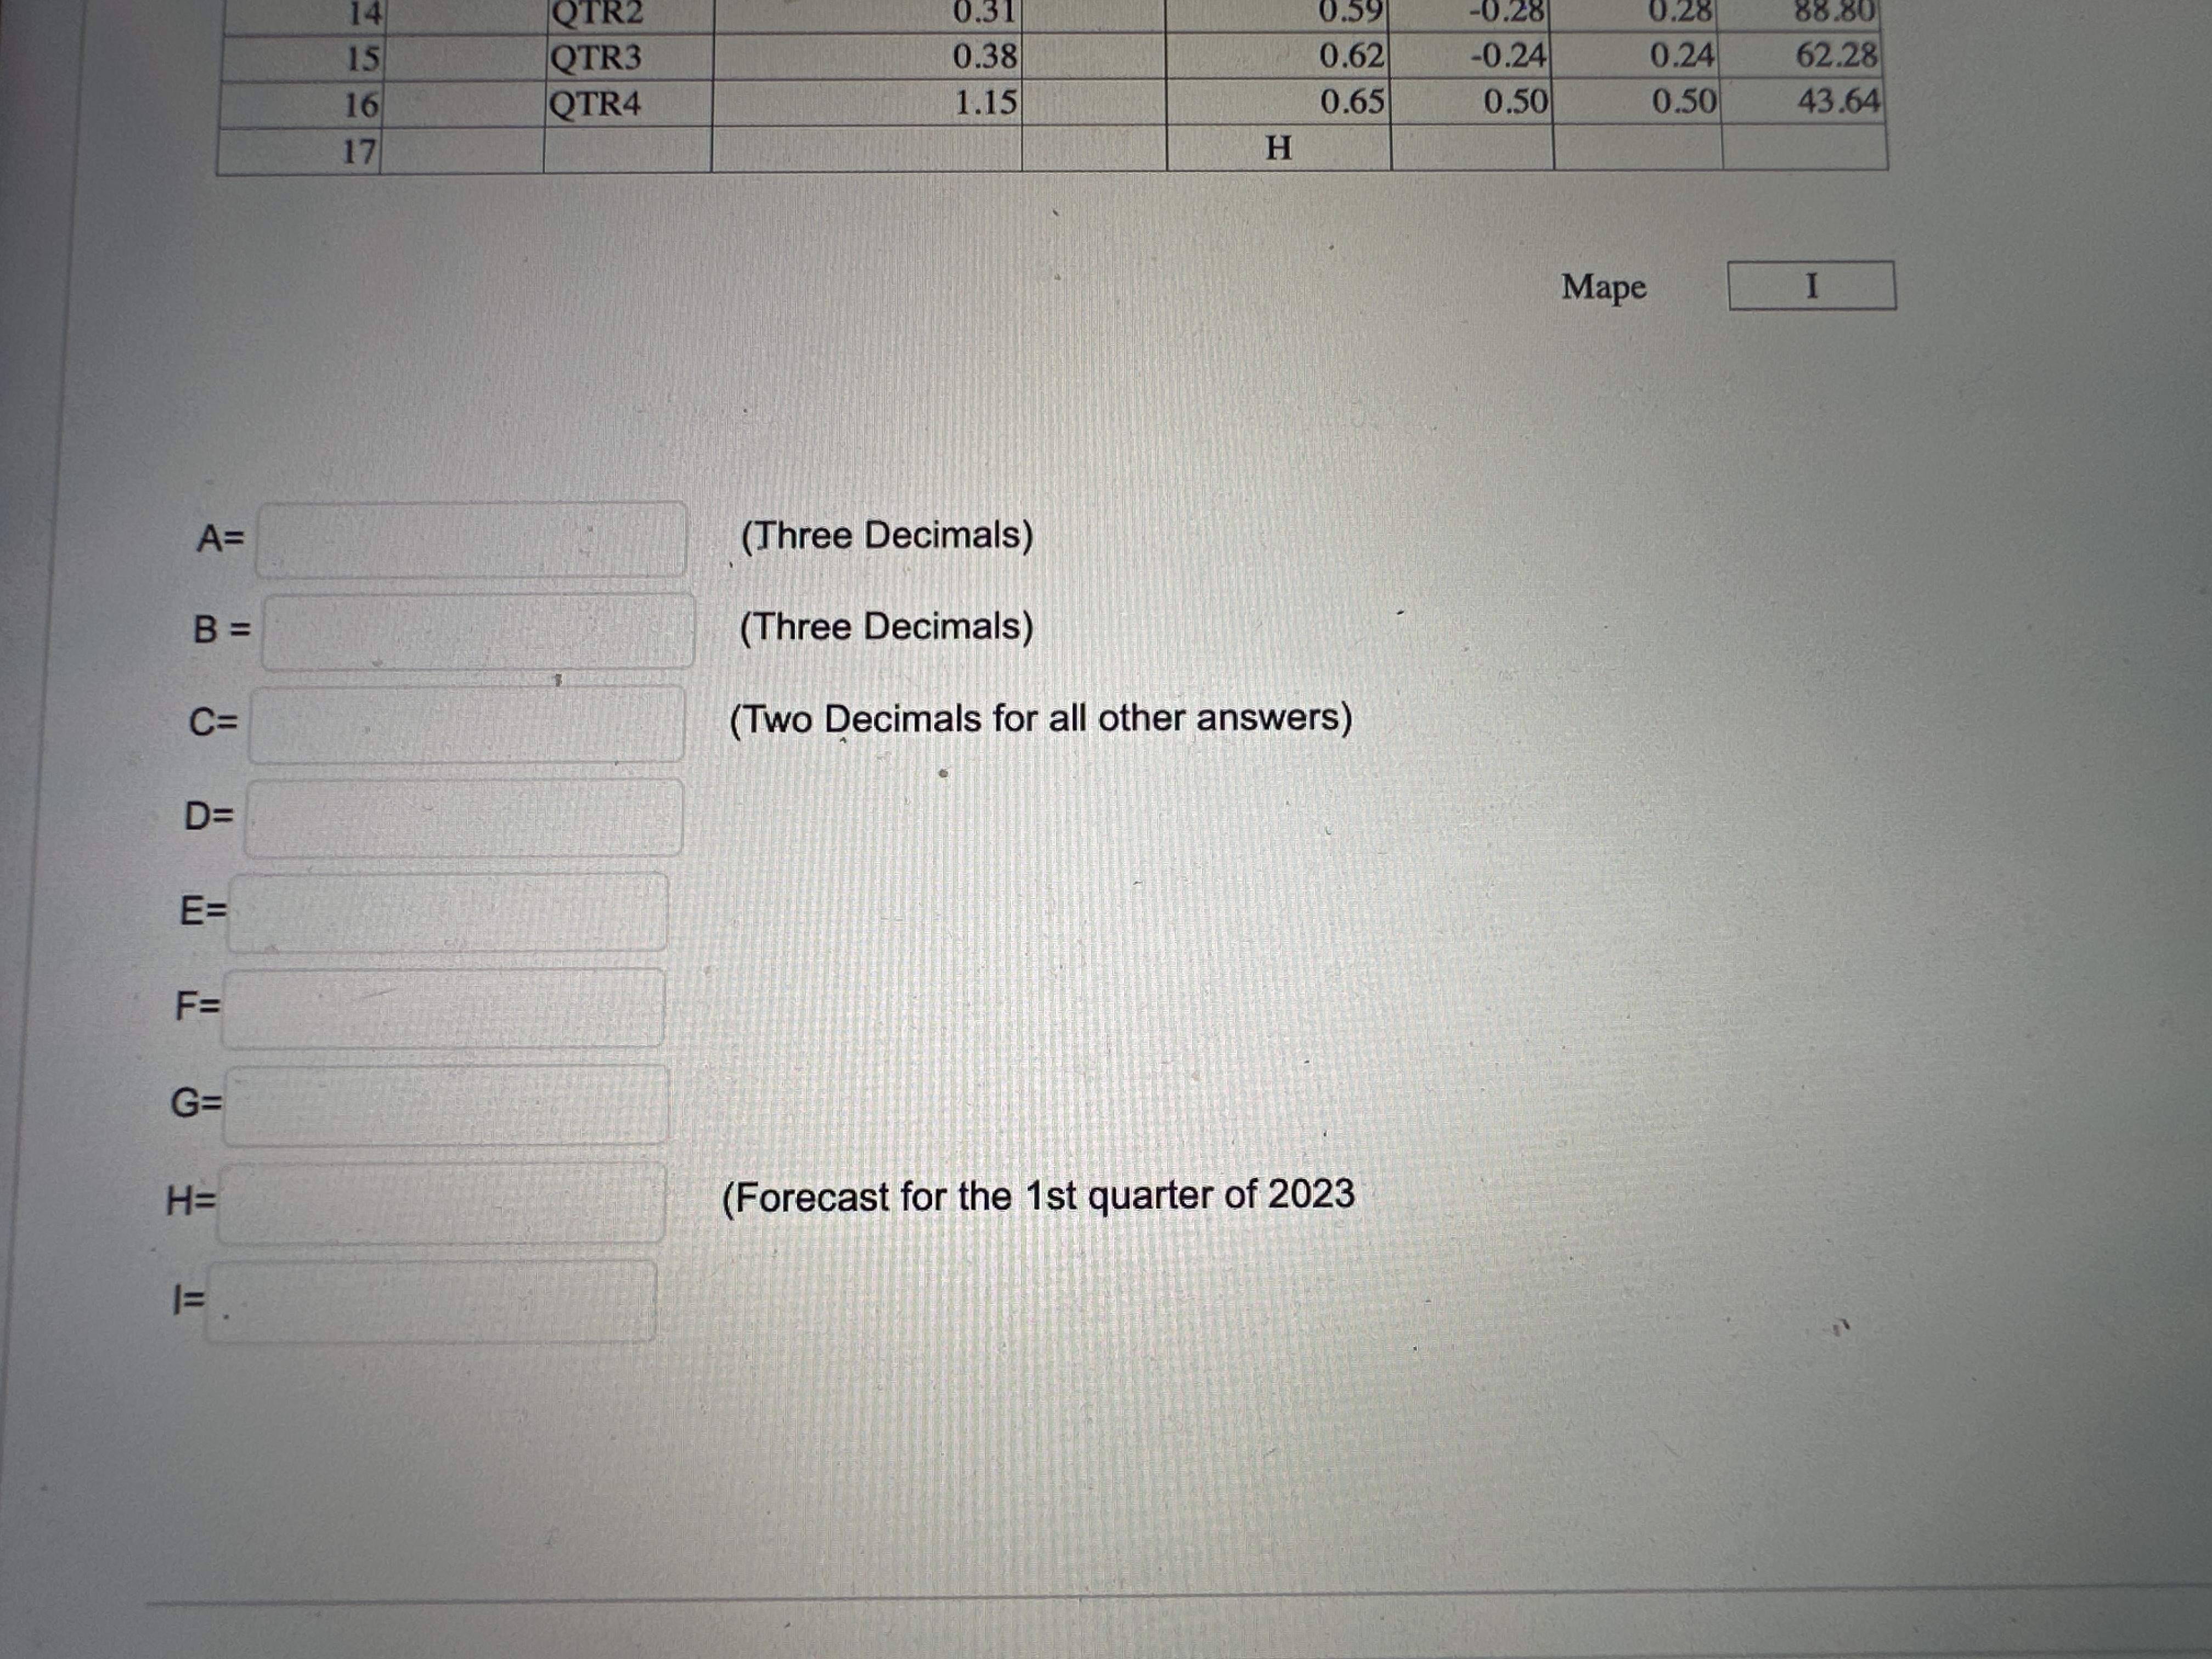
Continue with the toy forecast. Forecast using a simple linear regression. Give the missing values. Linear intercept A Slope B Sales of Plush Toys Forecast In billions of dollars Straight line ABS APE Period Year Quarter Actual Sales Regression Error ERROR 1 2019 QTR 1 0.24 0.18 0.06 0.06 26.29 QTR2 0.16 0.21 -0.05 0.05 30.20 QTR3 0.20 0.24 -0.04 0.04 UA W N 19.87 QTR4 0.60 0.27 0.33 0.33 54.81 2020 QTR 1 0.26 0.30 -0.04 0.04 16.37 6 QTR2 C D E F G QTR3 0.22 0.37 -0.15 0.15 66.08 QTR4 0.65 0.40 0.25 0.25 38.95 9 2021 QTR 1 0.36 0.43 0.07 0.07 18.95 10 QTR2 0.24 0.46 0.22 0.22 91.51 11 QTR3 0.30 0.49 -0.19 0.19 63.68 12 OTR4 0.90 0.52 0.38 0.38 41.95 13 2022 QTR 1 0.46 0.55 -0.09 0.09 20.40 14 QTR2 0.31 0.59 0.28 0.28 88.80 15 QTR3 0.38 0.62 -0.24 0.24 62.28 16 QTR4 1.15 0.65 0.50 0.50 43.64 17 H Mape I A= (Three Decimals) B = (Three Decimals) C= (Two Decimals for all other answers)14 QTR2 0.31 0.59 -0.28 0.28 88.80 15 QTR3 0.38 0.62 -0.24 0.24 62.28 16 QTR4 1.15 0.65 0.50 0.50 43.64 17 H Mape I A= (Three Decimals) B = (Three Decimals) C= (Two Decimals for all other answers) D= E= F = G= H= (Forecast for the 1st quarter of 2023
Step by Step Solution
There are 3 Steps involved in it

Get step-by-step solutions from verified subject matter experts