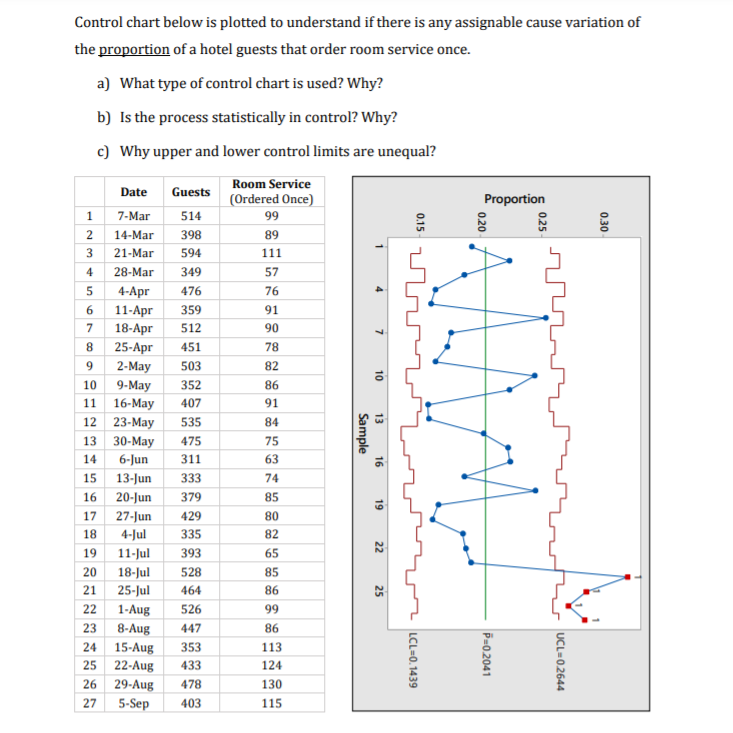
Question: Control chart below is plotted to understand if there is any assignable cause variation of the proportion of a hotel guests that order room service

Control chart below is plotted to understand ifControl chart below is plotted to understand if

Control chart below is plotted to understand if there is any assignable cause variation of the proportion of a hotel guests that order room service once. a) What type of control chart is used? Why? b) Is the process statistically in control? Why? c) Why upper and lower control limits are unequal? Room Service (Ordered Once) 99 Proportion 0.15 0.20 0.25 0.30 89 111 - Guests 514 398 594 349 476 359 512 451 57 76 91 90 4 7 78 503 10 82 86 91 Date 1 7-Mar 2 14-Mar 3 21-Mar 4 28-Mar 5 4-Apr 6 11-Apr 7 18-Apr 8 25-Apr 9 2-May 10 9-May 11 16-May 12 23-May 13 30-May 14 15 13-Jun 16 20-Jun 17 27-Jun 18 4-Jul 19 11.Jul 20 18-Jul 21 25-Jul 22 1-Aug 23 8-Aug 24 15-Aug 25 22-Aug 26 29-Aug 27 5-Sep 13 Sample 84 75 63 WAV 6-Jun 74 85 19 352 407 535 475 311 333 379 429 335 393 528 464 526 447 353 433 80 82 65 22 85 86 25 99 86 113 124 LC=0,1439 P-02041 UCL-0.2644 478 130 115 403 a) Comment on the fundamental difference between Cp and Cpk. b) Calculate Cp and Cpk for graphs (a) and (b). c) Justify the difference between Cpk calculated for graphs (a) and (b). LSL USL Process Data: LSL = 15.95 USL = 16.005 Sample Mean = 15.975 Sample N = 100 15.95 15.96 15.97 15.98 15.99 16.00 16.01 StDev (within) = 0.00406548 a) LSL USL Process Data: LSL = 15.95 USL = 16.005 Sample Mean = 16.0001 Sample N = 100 15.95 15.96 15.97 15.98 15.99 16.00 16.01 StDev (within) = 0.00406548 b)

Step by Step Solution

There are 3 Steps involved in it

1 Expert Approved Answer
Step: 1 Unlock blur-text-image
Question Has Been Solved by an Expert!

Get step-by-step solutions from verified subject matter experts

Step: 2 Unlock
Step: 3 Unlock

Students Have Also Explored These Related General Management Questions!