

Question: Control Chart Drawing Assignment The table below provides the number of alignment errors observed during the final inspection of a certain model of airplane. Calculate
Control Chart Drawing Assignment
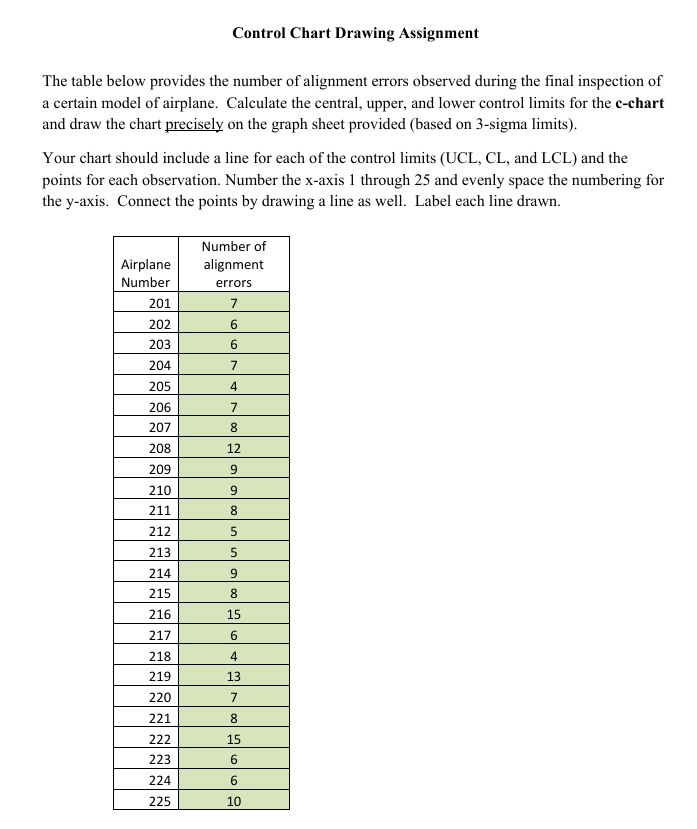
The table below provides the number of alignment errors observed during the final inspection of
a certain model of airplane. Calculate the central, upper, and lower control limits for the cchart
and draw the chart precisely on the graph sheet provided based on sigma limits
Your chart should include a line for each of the control limits UCL CL and LCL and the
points for each observation. Number the x axis through and evenly space the numbering for
the axis. Connect the points by drawing a line as well. Label each line drawn.
Step by Step Solution
There are 3 Steps involved in it
1 Expert Approved Answer
Step: 1 Unlock

Question Has Been Solved by an Expert!
Get step-by-step solutions from verified subject matter experts
Step: 2 Unlock
Step: 3 Unlock