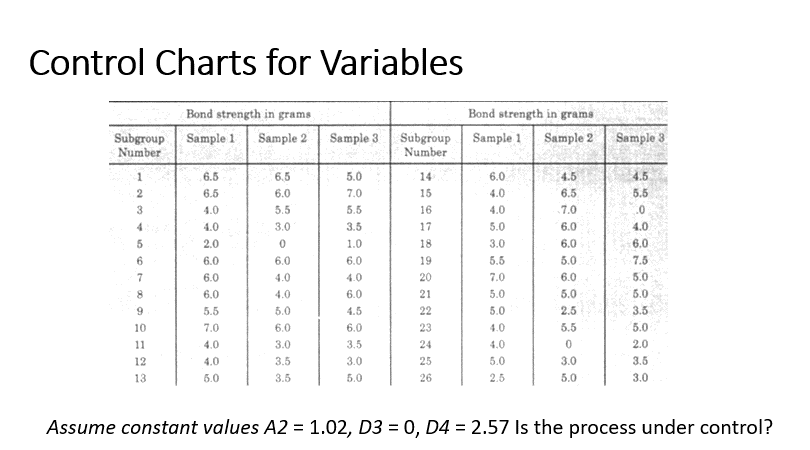
Question: Control Charts for Variables Bond strength in grams Sample 1 Sample 2 Bond strength in grams Sample 1 Sample 2 Subgroup Number Sample 3 Sample

Control Charts for Variables Bond strength in

Control Charts for Variables Bond strength in grams Sample 1 Sample 2 Bond strength in grams Sample 1 Sample 2 Subgroup Number Sample 3 Sample 3 4.5 1 2 3 5.0 7.0 5.5 3.5 6.5 6.5 4.0 4.0 2.0 6.0 6.0 6.0 5.5 7.0 4.0 4.0 5.0 5 6 7 8 9 10 6.5 6.0 5.5 3.0 0 6.0 4.0 4.0 5.0 6.0 3.0 3.5 3.5 6.0 4.0 4.0 5.0 3.0 5.5 7.0 5.0 Subgroup Number 14 15 16 17 18 19 20 21 22 23 24 25 26 1.0 6.0 4.0 6.0 4.5 6.0 3.5 3.0 5.0 4.5 6.5 7.0 6.0 6.0 5.0 6.0 5.0 2,5 5.5 0 3.0 5.5 0 4.0 6.0 7.5 5.0 5.0 3.8 5.0 2.0 3.5 3.0 5.0 11 12 13 4.0 4.0 5.0 2.5 5.0 Assume constant values A2 = 1.02, D3 = 0, D4 = 2.57 Is the process under control

Step by Step Solution

There are 3 Steps involved in it

1 Expert Approved Answer
Step: 1 Unlock blur-text-image
Question Has Been Solved by an Expert!

Get step-by-step solutions from verified subject matter experts

Step: 2 Unlock
Step: 3 Unlock

Students Have Also Explored These Related General Management Questions!