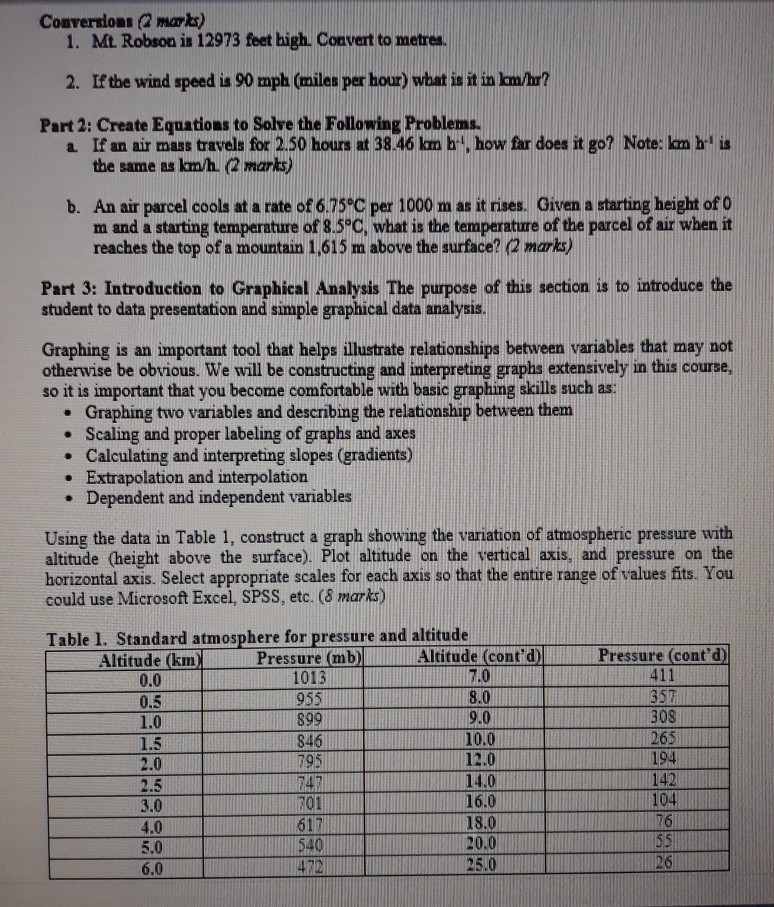
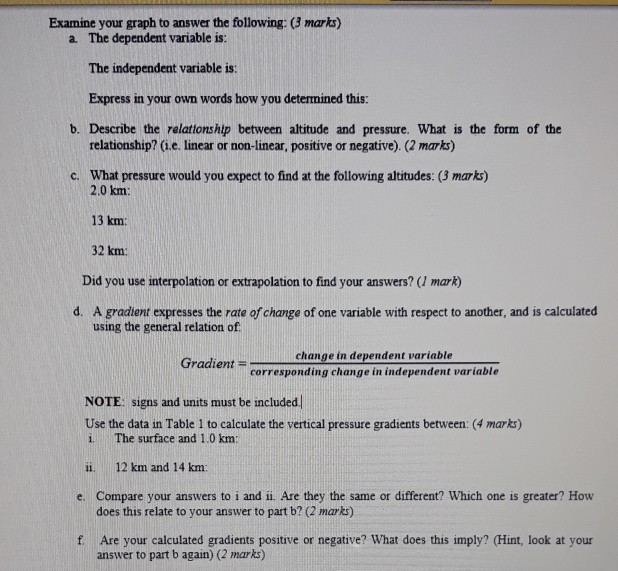
Conversions (2 marks) 1. Mt. Robson is 12973 feet high. Convert to metres. 2. If the...
Fantastic news! We've Found the answer you've been seeking!
Question:
Transcribed Image Text:
Conversions (2 marks) 1. Mt. Robson is 12973 feet high. Convert to metres. 2. If the wind speed is 90 mph (miles per hour) what is it in km/hr? Part 2: Create Equations to Solve the Following Problems. a. If an air mass travels for 2.50 hours at 38.46 km h, how far does it go? Note: lam his the same as km/h. (2 marks) b. An air parcel cools at a rate of 6.75°C per 1000 m as it rises. Given a starting height of 0 m and a starting temperature of 8.5°C, what is the temperature of the parcel of air when it reaches the top of a mountain 1,615 m above the surface? (2 marks) Part 3: Introduction to Graphical Analysis The purpose of this section is to introduce the student to data presentation and simple graphical data analysis. Graphing is an important tool that helps illustrate relationships between variables that may not otherwise be obvious. We will be constructing and interpreting graphs extensively in this course, so it is important that you become comfortable with basic graphing skills such as: • Graphing two variables and describing the relationship between them • Scaling and proper labeling of graphs and axes . • Calculating and interpreting slopes (gradients) • Extrapolation and interpolation • Dependent and independent variables . Using the data in Table 1, construct a graph showing the variation of atmospheric pressure with altitude (height above the surface). Plot altitude on the vertical axis, and pressure on the horizontal axis. Select appropriate scales for each axis so that the entire range of values fits. You could use Microsoft Excel, SPSS, etc. (8 marks) Table 1. Standard atmosphere for pressure and altitude Pressure (mb) Altitude (km) 0.0 0.5 1.0 1.5 2.0 2.5 3.0 4.0 5.0 6.0 1013 955 899 846 795 747 701 617 540 472 Altitude (cont'd) 7.0 8.0 9.0 10.0 12.0 14.0 16.0 18.0 20.0 25.0 Pressure (cont'd) 411 357 308 265 194 142 104 76 55 26 Examine your graph to answer the following: (3 marks) a. The dependent variable is: The independent variable is: Express in your own words how you determined this: b. Describe the relationship between altitude and pressure. What is the form of the relationship? (i.e. linear or non-linear, positive or negative). (2 marks) c. What pressure would you expect to find at the following altitudes: (3 marks) 2.0 km: 13 km: 32 km: Did you use interpolation or extrapolation to find your answers? (1 mark) d. A gradient expresses the rate of change of one variable with respect to another, and is calculated using the general relation of Gradient- E change in dependent variable corresponding change in independent variable NOTE: signs and units must be included. Use the data in Table 1 to calculate the vertical pressure gradients between: (4 marks) 1. The surface and 1.0 km: 11. 12 km and 14 km: e. Compare your answers to i and ii. Are they the same or different? Which one is greater? How does this relate to your answer to part b? (2 marks) f. Are your calculated gradients positive or negative? What does this imply? (Hint, look at your answer to part b again) (2 marks) Conversions (2 marks) 1. Mt. Robson is 12973 feet high. Convert to metres. 2. If the wind speed is 90 mph (miles per hour) what is it in km/hr? Part 2: Create Equations to Solve the Following Problems. a. If an air mass travels for 2.50 hours at 38.46 km h, how far does it go? Note: lam his the same as km/h. (2 marks) b. An air parcel cools at a rate of 6.75°C per 1000 m as it rises. Given a starting height of 0 m and a starting temperature of 8.5°C, what is the temperature of the parcel of air when it reaches the top of a mountain 1,615 m above the surface? (2 marks) Part 3: Introduction to Graphical Analysis The purpose of this section is to introduce the student to data presentation and simple graphical data analysis. Graphing is an important tool that helps illustrate relationships between variables that may not otherwise be obvious. We will be constructing and interpreting graphs extensively in this course, so it is important that you become comfortable with basic graphing skills such as: • Graphing two variables and describing the relationship between them • Scaling and proper labeling of graphs and axes . • Calculating and interpreting slopes (gradients) • Extrapolation and interpolation • Dependent and independent variables . Using the data in Table 1, construct a graph showing the variation of atmospheric pressure with altitude (height above the surface). Plot altitude on the vertical axis, and pressure on the horizontal axis. Select appropriate scales for each axis so that the entire range of values fits. You could use Microsoft Excel, SPSS, etc. (8 marks) Table 1. Standard atmosphere for pressure and altitude Pressure (mb) Altitude (km) 0.0 0.5 1.0 1.5 2.0 2.5 3.0 4.0 5.0 6.0 1013 955 899 846 795 747 701 617 540 472 Altitude (cont'd) 7.0 8.0 9.0 10.0 12.0 14.0 16.0 18.0 20.0 25.0 Pressure (cont'd) 411 357 308 265 194 142 104 76 55 26 Examine your graph to answer the following: (3 marks) a. The dependent variable is: The independent variable is: Express in your own words how you determined this: b. Describe the relationship between altitude and pressure. What is the form of the relationship? (i.e. linear or non-linear, positive or negative). (2 marks) c. What pressure would you expect to find at the following altitudes: (3 marks) 2.0 km: 13 km: 32 km: Did you use interpolation or extrapolation to find your answers? (1 mark) d. A gradient expresses the rate of change of one variable with respect to another, and is calculated using the general relation of Gradient- E change in dependent variable corresponding change in independent variable NOTE: signs and units must be included. Use the data in Table 1 to calculate the vertical pressure gradients between: (4 marks) 1. The surface and 1.0 km: 11. 12 km and 14 km: e. Compare your answers to i and ii. Are they the same or different? Which one is greater? How does this relate to your answer to part b? (2 marks) f. Are your calculated gradients positive or negative? What does this imply? (Hint, look at your answer to part b again) (2 marks)
Expert Answer:
Answer rating: 100% (QA)
The first question that needs to be answered is the conversion of Mr Robsons height from feet to meters To convert feet to meters we use the conversion factor where 1 foot equals 03048 meters 1 Mr Rob... View the full answer
Related Book For
Posted Date:
Students also viewed these accounting questions
-
To convert wind speeds in miles per hour to knots, divide by 1.15. Use this information and the Saffir-Simpson Hurricane Intensity chart below to answer following Exercises Round to the nearest...
-
A driver's average speed is 50 miles per hour on a round trip between two cities 100 miles apart. The average speeds for going and returning were x and y miles per hour, respectively. (a) Show that y...
-
A person travels d miles at a constant speed s (in miles per hour) for t hours. a. Complete Table 20 to help find a formula that describes the association among s, t, and d. Show the arithmetic to...
-
Yamini and Fatima, two students of Class IX of a school, together contributed Rs. 100 towards the Prime Ministers Relief Fund to help the earthquake victims. Write a linear equation which satisfies...
-
Sherwin Company makes bicycles. Various divisions make components and transfer them to the Dayton division for assembly into final products. The Dayton division can also buy components from external...
-
If the work required to stretch a spring 1 ft beyond its natural length is 12 ft-lb, how much work is needed to stretch it 9 in. beyond its natural length?
-
Pileri Industries shipped goods to Consolidated Industries, Inc., via a common carrier. The goods were lost in transit. Pileri claimed that the sale was a shipment contract, thus putting the risk of...
-
Multiple Choice. Choose the best answer. 1. Under GASB standards, public colleges and universities engaged only in business-type activities present all of the following statements in their...
-
2) Rolf throws a small bouncy ball of mass 52.0 g with speed 15.1 m/s. The ball bounces off a wall, rebounding at 13.8 m/s. The ball is in contact with the wall for 2.25 milliseconds (2.25 ms). Find...
-
Answer these questions, based on the debit memorandum shown here. 1. Which company is returning the merchandise? 2. How many items are being returned? 3. What amount is entered in the journal entry?...
-
Question 5 The possibility is being investigated of changing the size of the near-spherical catalyst pellets used in a fixed bed tubular reactor in which an irreversible first order reaction is...
-
Suppose there are three equally likely states of nature: expansion (E), normal (N) and recession (R). You have information about two assets (A and B) whose prices and payoffs as a function of the...
-
Booke Manufacturing had worked on two jobs. Job 101 and Job 102 last year. The estimated manufacturing overhead for last year was P 30.000 (fixed) and P5.00 per direct labor hour (variable) and...
-
Consider an alternative WiFi protocol in which RTS/CTS is not exchanged, instead, the transmitter directly sends the DATA packet (after performing carrier sense and backoff). Does this alternative...
-
Richard Stokes borrows $65,000 to buy new equipment for his factory. Its a 3 year loan with 7 percent interest and will be paid with fixed annual payments. Prepare an amortization table. Show all of...
-
Provide a supply and demand graph to show impact of following on equilibrium prices and quantity for texas instrument calculator as well as filling in the blanks. Thanks! Question 12 Use a supply and...
-
The time between arrivals of vehicles at a particular intersection follows an exponential probability distribution with a mean of 12 seconds. Sketch this exponential probability distribution. f(x)...
-
A copper wire (density = 8.96 g/cm 3 ) has a diameter of 0.25 mm. If a sample of this copper wire has a mass of 22 g, how long is the wire?
-
For following Exercises, the solutions have been started for you. bees have been known to chase people for up to1/4 of a mile, while domestic European honeybees will normally chase a person for no...
-
Find the area of each geometric figure. If the figure is a circle, give an exact area and then use the given approximation for p to approximate the area. 1. 2. 4.25 cm 3 cm Parallelogram Trapezoid 6...
-
Find the perimeter of each figure. 1. 2. 3. 13 in. 6 in. 13 in. 30 in. 16 cm 2 cm 11 cm 4 cm 3 cm 9 cm
-
A candlestick chart is similar to a bar chart except that the candlestick chart: A. Represents upward movements in price with Xs. B. Also graphically shows the range of the periods highs and lows. C....
-
What considerations might encourage a market analyst to rely more on a top-down or bottom-up forecast of S&P 500 operating earnings?
-
Which of the following advantages listed by Ryan with respect to the earnings-based approach studied by Atkinson is most likely correct? The model A. Can be used for non-U.S. equity markets. B....
Study smarter with the SolutionInn App