

Question: Convert the list to a table. Sort values from the biggest to the smallest value. Create two charts from the table. Please feel free to
- Convert the list to a table.
- Sort values from the biggest to the smallest value.
- Create two charts from the table. Please feel free to choose any chart type that you think would best represent the data.
- Title your charts "Brown's Family Expenses, Q3 2022". Try adding legends and any element you wish to add. You may also experiment with differ
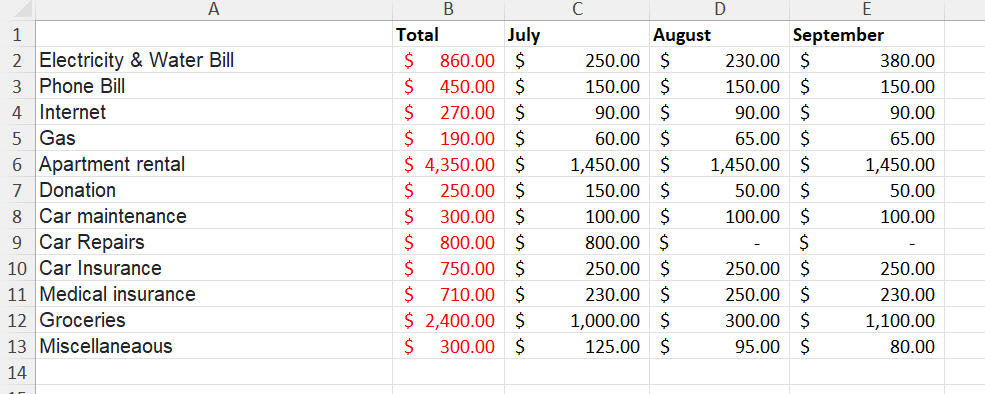 ent chart designs.
Step by Step Solution
There are 3 Steps involved in it
1 Expert Approved Answer
Step: 1 Unlock

Question Has Been Solved by an Expert!
Get step-by-step solutions from verified subject matter experts
Step: 2 Unlock
Step: 3 Unlock