

Question: Cooper Electronics uses NPV profiles to visually evaluate competing projects. Key data for the two projects under consideration are given in the following table: :.
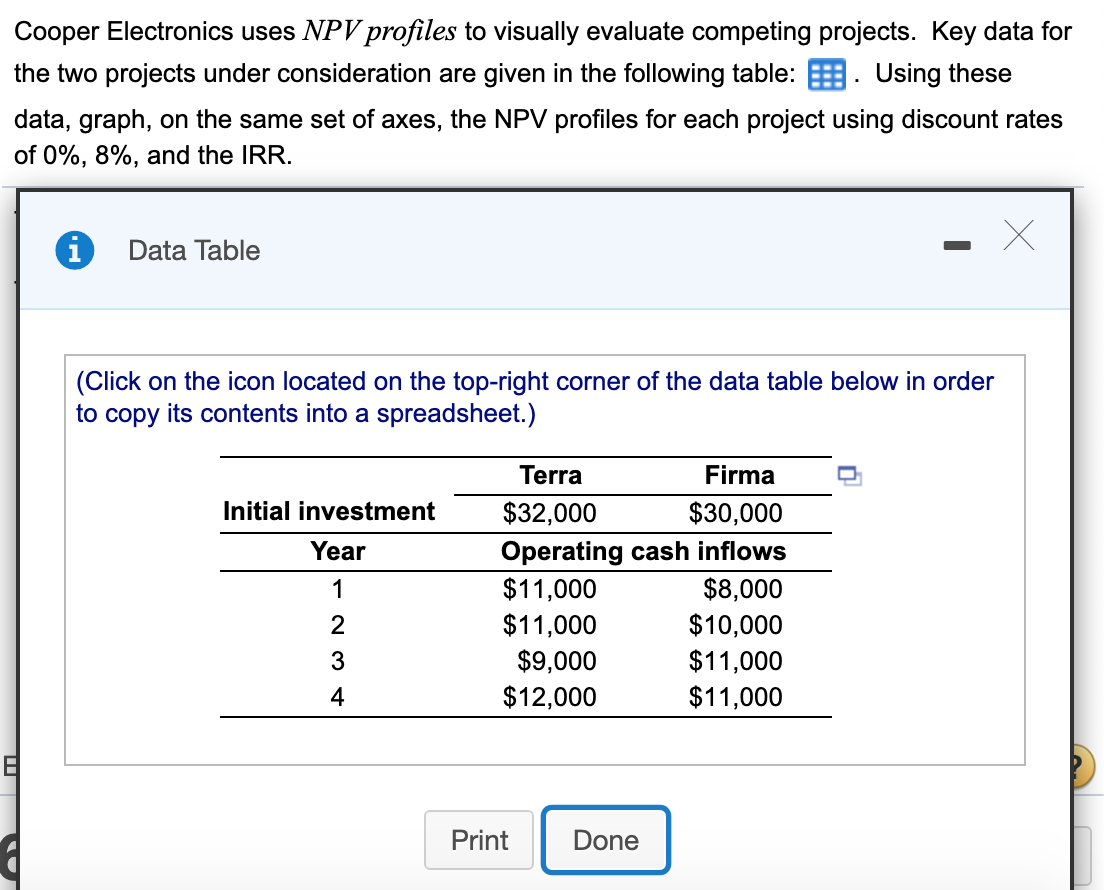
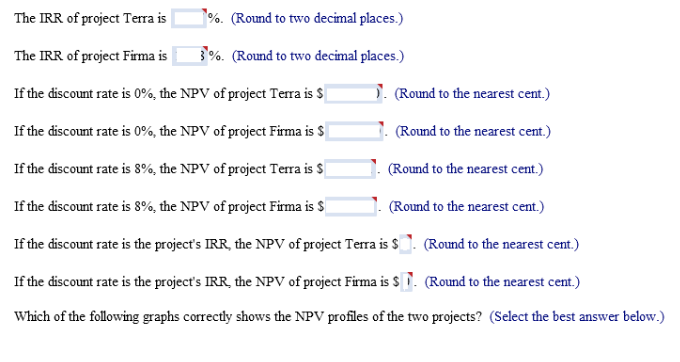
Cooper Electronics uses NPV profiles to visually evaluate competing projects. Key data for the two projects under consideration are given in the following table: :. Using these data, graph, on the same set of axes, the NPV profiles for each project using discount rates of 0%, 8%, and the IRR. Data Table (Click on the icon located on the top-right corner of the data table below in order to copy its contents into a spreadsheet.) Initial investment Year Terra Firma $32,000 $30,000 Operating cash inflows $11,000 $8,000 $11,000 $10,000 $9,000 $11,000 $12,000 $11,000 AWN- Print Print Done Done The IRR of project Terra is %. (Round to two decimal places.) The IRR of project Firma is 3%. (Round to two decimal places.) If the discount rate is 0%, the NPV of project Terra is $ . (Round to the nearest cent.) If the discount rate is 0%, the NPV of project Firma is $ . (Round to the nearest cent.) If the discount rate is 8%, the NPV of project Terra is $ . (Round to the nearest cent.) If the discount rate is 8%, the NPV of project Firma is $ (Round to the nearest cent.) If the discount rate is the project's IRR, the NPV of project Terra is $. (Round to the nearest cent.) If the discount rate is the project's IRR, the NPV of project Firma is $. (Round to the nearest cent.) Which of the following graphs correctly shows the NPV profiles of the two projects? (Select the best answer below.)
Step by Step Solution
There are 3 Steps involved in it

Get step-by-step solutions from verified subject matter experts